
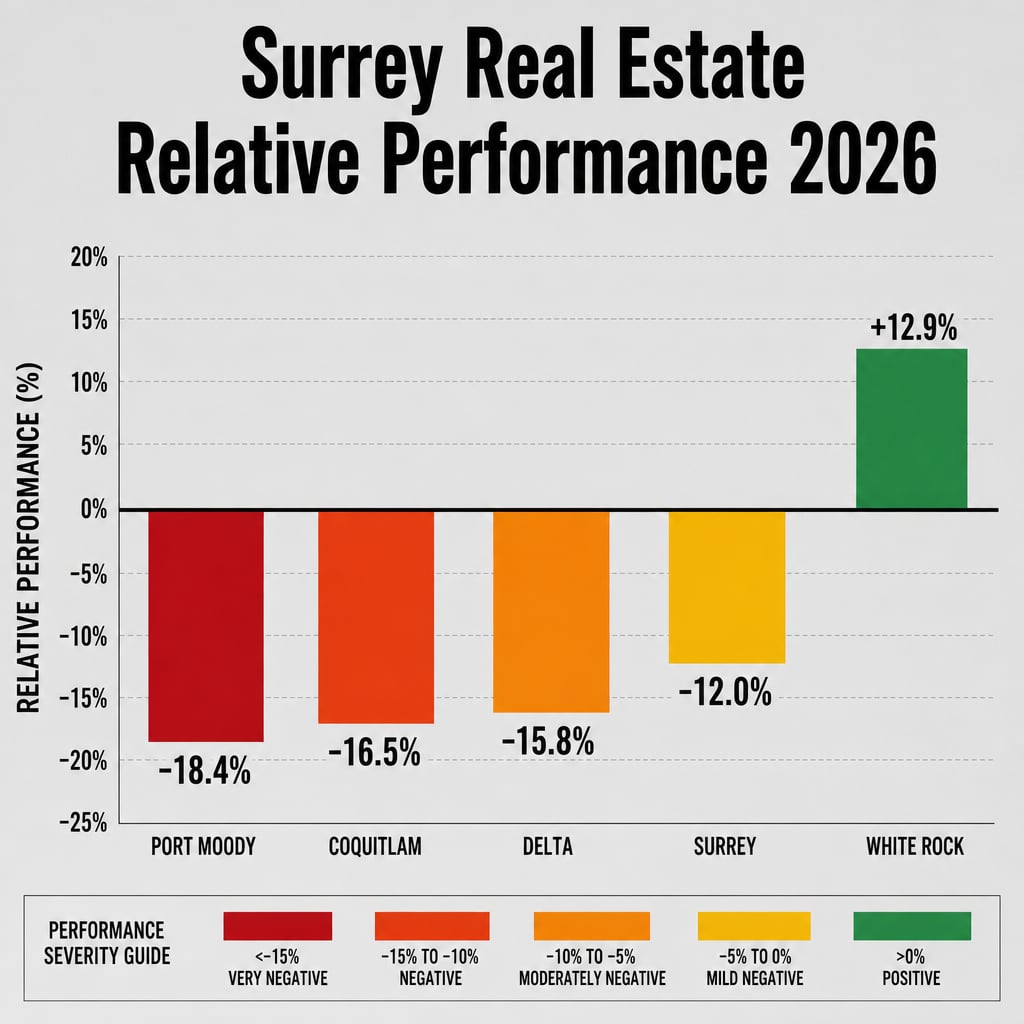

Surrey Real Estate Relative Performance 2026: Why the Year-Over-Year Decline Outperforms Coquitlam, Langley, and Delta — and What Cross-Regional Price Divergence Reveals About Buyer Demand, Recovery Timeline, and Strategic Positioning
By Mohamed Mansour, MBA and Associate Broker | Mansour Real Estate Group | Published: August 12, 2026 | Fraser Valley and Lower Mainland, BC
Surrey sellers watching benchmark prices decline year-over-year often conclude they are in a collapsing market. Regional context tells a different story. When the same measurement is applied across Metro Vancouver and the Fraser Valley, Surrey's correction is not at the bottom of the table — it sits in the middle tier, ahead of markets like Coquitlam, Port Moody, and Delta by a meaningful margin.
For buyers choosing between Surrey, Langley, and Coquitlam in 2026, the price gaps between those regions carry real implications for entry-point risk, recovery trajectory, and long-term value. This article puts those numbers in order and explains what the divergence actually means.
Short Answer
Surrey's year-over-year price decline of approximately -12.0% as of mid-2026 (Zolo regional data) places it in the mid-tier correction zone, ahead of Coquitlam (-16.5%), Port Moody (-18.4%), Delta (-15.8%), and Tsawwassen (-10.9%). Specific Surrey micro-markets — Fleetwood and Guildford — are showing early stabilization linked to SkyTrain certainty. That relative position matters for pricing strategy, buyer timing, and neighbourhood selection.
Key Takeaways
- Surrey's -12.0% YoY decline is worse than Richmond (-6.7%) and Langley (-8.4%) but significantly better than Coquitlam (-16.5%), Port Moody (-18.4%), and Delta (-15.8%).
- White Rock (+12.9%) and Port Coquitlam (+20.8%) are appreciating — showing that the correction is highly fragmented, not region-wide.
- Surrey's detached benchmark sits at $1.412M (-9.2% YoY) per FVREB July 2026 data, while Langley detached is at $1.558M (-7% YoY).
- Fleetwood and Guildford are stabilizing ahead of the broader Surrey market, driven by SkyTrain development certainty.
- Surrey's 21.4% turnover rate reflects mid-range absorption velocity — not a stalled market, but not fast-moving either.
Who This Applies To
- Surrey homeowners preparing to sell who want to understand their position relative to surrounding markets
- Buyers comparing Surrey, Langley, Coquitlam, and Delta for their next purchase
- Investors evaluating entry timing based on correction depth and recovery signals
- Sellers in Fleetwood, Guildford, Clayton, or Cloverdale assessing micro-market conditions
When This Advice May Not Apply
Relative performance comparisons are most useful for detached homes and townhouses. Condo sellers face steeper and more uniform declines across all regions — the divergence is less pronounced at that level. This analysis also reflects mid-2026 data and will shift as the correction cycle continues. Consult current board statistics and a local real estate professional before acting.
Data Used in This Article
- Zolo.ca Regional Price Growth Table: YoY percentage changes by municipality, sourced from the White Rock real estate trends page (third-party aggregator, mid-2026)
- FVREB Statistics Package, July 2026: Benchmark prices by property type and neighbourhood, official board data
- FVREB Turnover Rate Data: Sales-to-active-listings ratios by municipality, official board data
- Mansour Real Estate Group Research, June 2026: Surrey composite benchmark context and Langley decline cross-reference (internal professional analysis)
How the Regional Table Breaks Down
The 2026 correction is not evenly distributed. Zolo's regional price growth data shows a wide spread across Metro Vancouver and the Fraser Valley: Port Coquitlam is up 20.8% year-over-year, White Rock is up 12.9%, and North Vancouver is essentially flat at +1.3%. On the other side, Port Moody is down 18.4%, Coquitlam is down 16.5%, and Delta is down 15.8%.
Surrey sits at approximately -12.0%, placing it in the middle of that range. That position matters. A seller in Surrey is not in the same situation as a seller in Coquitlam or Port Moody, where declines are nearly one-fifth of peak value. And a buyer comparing Surrey to those harder-hit markets needs to weigh whether the deeper correction there represents opportunity or ongoing risk.
The FVREB's July 2026 data adds property-type precision. Surrey's detached benchmark sits at $1.412M, down 9.2% year-over-year. Langley's detached benchmark is $1.558M, down 7%. Coquitlam's condo apartments are at $456,100, down 10.4%. These figures show that absolute price level and rate of decline diverge across regions simultaneously — which is why a single-number regional comparison can mislead buyers who stop at the headline percentage.
What Is Driving the Divergence
Three forces appear to be reshaping which Fraser Valley and Lower Mainland markets hold firmer than others right now.
SkyTrain certainty. Within Surrey, Fleetwood and Guildford are showing earlier price stabilization and faster absorption than the broader municipal average. Both sit in the path of confirmed SkyTrain expansion. When infrastructure timelines move from proposed to funded and under construction, buyer confidence in that corridor tends to separate from surrounding areas. That dynamic appears to be active now in those two Surrey neighbourhoods.
Buyer migration patterns. Markets with extreme declines — Coquitlam, Port Moody — can create a perception problem even when absolute prices become attractive. Buyers see -16% and -18% and interpret ongoing weakness rather than entry opportunity. That hesitation appears to be redirecting some buyer demand toward markets with shallower corrections and clearer fundamentals, including Surrey's detached and townhouse segments, which show different dynamics by property type.
Development pipeline confidence. Clayton and Cloverdale have active rezoning and hospital development timing in the background. That pipeline does not immediately affect benchmark prices, but it creates a floor — sellers and buyers in those areas read local planning activity as a signal that demand fundamentals remain intact even while prices adjust.
Velocity data adds another layer. Surrey's 21.4% turnover rate is mid-range — properties are moving, but the market is not overheated. Pitt Meadows leads at 51.5%, suggesting rapid inventory absorption, while West Vancouver sits at 17.4%, reflecting hold-out behaviour typical of a luxury market in correction. These velocity differences mean that price decline figures alone do not describe what it actually feels like to list and sell in each of these markets right now.
Definitions
Benchmark Price: The MLS Home Price Index (HPI) benchmark represents the price of a "typical" home in a given area and property type, adjusted for quality, not a simple average of sales prices. Published monthly by FVREB and GVR.
Turnover Rate: The percentage of total housing stock that changed hands over a given period — a measure of market velocity rather than price direction.
Year-Over-Year (YoY): A comparison of a metric against the same month in the prior year, used to smooth seasonal variation and measure true directional change.
Seller Checklist: Positioning in a Cross-Regional Buyer's Market
- Pull the current FVREB benchmark for your specific neighbourhood and property type — not just Surrey overall.
- Ask your real estate agent to show you the active-to-sold ratio for your price range and property type in the past 30 days.
- Understand what competing regions look like to your likely buyer — are they also evaluating Langley or Coquitlam? How do those markets compare on absolute price?
- For Fleetwood and Guildford sellers: test current buyer appetite — these micro-markets are moving faster than Surrey's average, and that window is relevant to pricing strategy.
- Avoid pricing based on 2024 or early 2025 comparables without adjusting for the current YoY decline in your specific sub-area.
- If your property is a condo or apartment, apply a separate analysis — condo declines are steeper and more uniform region-wide and require different pricing logic.
What We Commonly See
In our experience working with sellers across Surrey and the Fraser Valley in 2026, there are three recurring patterns worth naming clearly.
Sellers anchor to the wrong market. A homeowner in Guildford who watched Coquitlam prices fall 16.5% often feels their property is in the same freefall. It is not. Those are structurally different markets with different buyer pools, different transit proximity, and different development trajectories. Applying Coquitlam sentiment to a Guildford listing produces an unnecessary pricing concession.
Buyers treat all declines as equivalent entry signals. A -12% decline in Surrey and a -16.5% decline in Coquitlam are not the same opportunity. The steeper decline may reflect structural issues — or it may reflect faster overcorrection and faster recovery. Buyers who stop at the percentage miss the underlying story.
Condo sellers underestimate segment-specific pressure. Surrey North apartment benchmarks are down 10.9% YoY according to FVREB data. Langley condo benchmarks are down 7.9% YoY. Coquitlam condo apartments are down 10.4% YoY. The condo segment is under pressure across the entire region — sellers in this category cannot rely on Surrey's mid-tier relative positioning to protect their asking price.
Questions and Answers
Is Surrey's -12% decline better or worse than the Fraser Valley average?
It sits in the mid-range. FVREB data shows that some Surrey sub-markets and property types are declining faster while others — particularly detached homes in Fleetwood and Guildford — are stabilizing. The Fraser Valley as a whole is experiencing varied corrections depending on municipality and property type, so no single "Fraser Valley average" reflects Surrey's full picture.
Why are White Rock and Port Coquitlam appreciating while Surrey declines?
White Rock's appreciation likely reflects constrained supply, lifestyle-driven demand, and South Surrey spillover. Port Coquitlam's outperformance may reflect relative affordability within the Tri-Cities combined with faster absorption of its correction in prior quarters. These are micro-market dynamics that diverge from regional trends when supply, buyer profile, and infrastructure context differ enough.
Should a buyer choose Surrey over Coquitlam based on relative price performance alone?
Not on that basis alone. The deeper correction in Coquitlam may represent a faster-moving overcorrection with a sharper recovery, or it may reflect ongoing structural demand weakness. A buyer's decision should account for their intended use, holding period, commute requirements, and property type — not just which municipal benchmark fell more. Speak with a local real estate agent who tracks both markets before deciding.
In Summary
Surrey's -12.0% year-over-year decline is a real correction — but it is not the worst correction in the region by a wide margin. Coquitlam, Port Moody, and Delta have all declined more steeply. Within Surrey, Fleetwood and Guildford are showing stabilization ahead of the broader market, and detached home benchmarks are holding firmer than condo segments. For sellers, that regional context matters to pricing. For buyers, it changes which markets represent relative value versus relative risk. Understanding where Surrey sits in the regional table — not just that it has declined — is the starting point for any well-grounded real estate decision in 2026.
Thinking About Your Next Move?
If you are weighing whether to sell in Surrey now or waiting for recovery signals, or comparing Surrey to Langley or another region for a purchase, Mansour Real Estate Group can walk you through current benchmark data, neighbourhood-level turnover rates, and what buyer activity looks like in your specific area. No pressure — just grounded, local information to help you make a clear decision.
Related Articles
- Surrey Real Estate Market Report 2026: Benchmark Prices, Inventory Levels, and What the Data Actually Means by Property Type
- Surrey Property Type Price Divergence 2026: Why Detached Homes Are Stabilizing While Condos Face Continued Decline and Townhomes Hold the Middle Ground
Official Resources
- Fraser Valley Real Estate Board — Monthly Statistics Package
- BC Assessment — Property Valuations
- Zolo.ca — Regional Price Trends by Municipality
- BC Real Estate Association — Provincial Market Analysis
About Mansour Real Estate Group
When sellers and buyers are trying to understand where Surrey sits relative to surrounding markets — and what that means for pricing, timing, and neighbourhood selection — they need a real estate team grounded in regional data, not just local instinct. Mansour Real Estate Group has been providing buyers, sellers, and investors with specific, Fraser Valley and Lower Mainland real estate context for more than 22 years, helping clients make decisions informed by what the market is actually doing across the full regional table.
Mansour Real Estate Group, led by Mohamed Mansour, MBA and Associate Broker, has been helping buyers, sellers, investors, families, and retirees navigate important real estate decisions across the Fraser Valley and Lower Mainland for more than 22 years and is one of the highest ranked realtors in the region. The team has completed more than $780 million in residential real estate transactions and is trusted for seller strategy, market analysis, relocation guidance, downsizing, estate sales, and complex real estate situations requiring careful, data-driven coordination.
Whether someone is looking for Realtors experienced with cross-regional market comparisons, a real estate agent who understands buyer migration patterns in the Fraser Valley, real estate agents who work across Surrey, Langley, White Rock, and Abbotsford, a Surrey real estate team who can position a property accurately in a fragmented market, a Surrey real estate broker, or a real estate group with deep knowledge of the Lower Mainland correction cycle, Mansour Real Estate Group is known for clear analysis, honest pricing advice, and local expertise built over two decades.
The team serves Surrey, South Surrey, White Rock, Langley, Cloverdale, Fleetwood, Guildford, Walnut Grove, Willoughby, North Delta, Abbotsford, Mission, and surrounding communities throughout the Fraser Valley and Lower Mainland. Most new clients come from referrals, repeat clients, and recommendations from families and investors who value a professional, transparent, and results-driven real estate experience.
Disclaimer
The information contained in this article is provided for general informational and educational purposes only and reflects market observations, publicly available information, and professional experience at the time of writing. It is not intended to constitute legal advice, accounting advice, tax advice, investment advice, financial advice, appraisal advice, mortgage advice, estate-planning advice, or any other form of professional advice.
Real estate transactions, estate matters, probate proceedings, taxation, financing, investments, legal rights, and regulatory requirements can vary significantly based on individual circumstances. Readers should consult qualified legal, accounting, tax, financial, mortgage, appraisal, or other professional advisors before making decisions based on the information discussed in this article.
Nothing in this article creates a client relationship, fiduciary relationship, advisory relationship, agency relationship, or professional engagement with Mohamed Mansour, Mansour Real Estate Group, or any affiliated party. Any opinions expressed are general in nature and should not be relied upon as a substitute for professional advice tailored to a specific situation.
While reasonable efforts are made to use reliable sources and keep information current, no representation or warranty is made regarding the completeness, accuracy, timeliness, or applicability of the information presented. Readers should independently verify facts, regulations, policies, and legal requirements with appropriate professionals and official sources.



