

By Mohamed Mansour, MBA and Associate Broker | Mansour Real Estate Group
Published: September 15, 2026 · Surrey, BC · Fraser Valley Real Estate
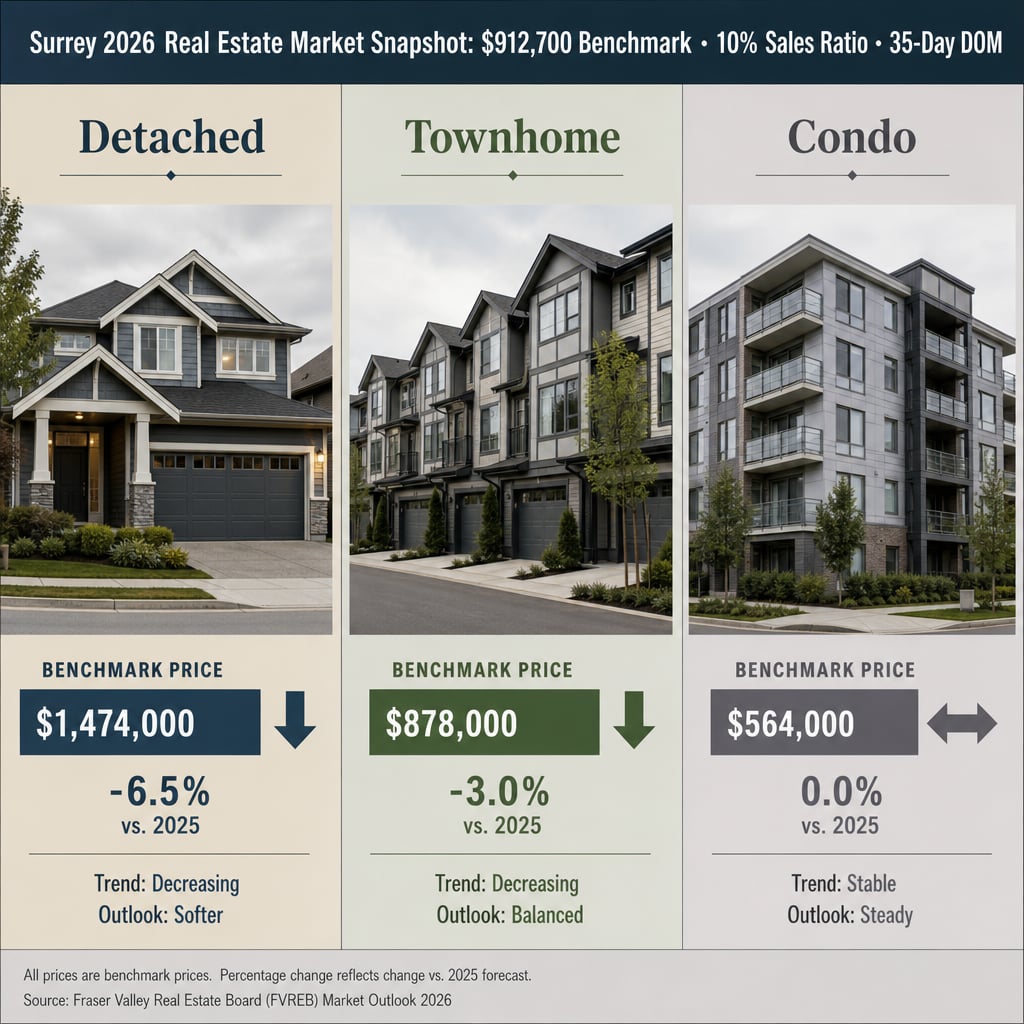
Surrey 2026 Real Estate Market Snapshot: What the $912,700 Benchmark, 10% Sales Ratio, and 35-Day DOM Actually Mean for Buyers and Sellers Across Detached, Townhome, and Condo Segments
Surrey's August 2026 market data tells a more complicated story than any single headline number can capture. The composite benchmark of $912,700 is real, but treating it as a single market condition is a mistake that costs both buyers and sellers. The actual picture is three separate recovery paths, two neighbourhoods being reshaped by infrastructure, and one inflection point that changes how pricing strategy should work right now.
This article translates the three core metrics — benchmark price, sales-to-active ratio, and days on market — into plain decisions for buyers and sellers across detached, townhome, and condo segments, with specific notes on how Fleetwood, Guildford, Newton, and Whalley are behaving differently from the city average.
Short Answer
Surrey's August 2026 composite benchmark is $912,700 — down 7.6% year-over-year. The 10% sales-to-active ratio marks the edge of balanced territory, up from buyer's market conditions earlier in 2026. Average days on market is approximately 35 days city-wide, but detached homes, townhomes, and condos are behaving very differently, and neighbourhood matters more than the average.
Key Takeaways
- The 10% sales-to-active ratio signals Surrey has moved from buyer's market into balanced territory as of August 2026.
- Detached prices fell roughly $94,000 from 2025 peaks; townhomes showed the most resilience of the three segments.
- Condos remain in buyer's market conditions despite improved affordability — low sell-through rates require careful pricing.
- Days-on-market variance between property types and neighbourhoods can reach 50–75%, making city-wide averages misleading.
- Fleetwood and Guildford are attracting disproportionate buyer attention due to confirmed SkyTrain expansion timelines.
Who This Applies To
- Homeowners in Surrey considering listing a detached home in 2026
- Condo owners evaluating whether to sell now or wait for conditions to shift
- Buyers deciding between segments or comparing neighbourhoods
- Investors tracking Surrey's recovery path relative to other Fraser Valley cities
- Executors or trustees managing a Surrey property sale under time constraints
When This Advice May Not Apply
If a property is subject to a legal order, estate deadline, or lender-imposed timeline, market conditions become a secondary constraint. Strategy changes significantly. Consult a qualified local team and, where applicable, a lawyer before acting on general market guidance.
Key Terms Defined
Benchmark Price: The price of a typical home in a given area and property type, adjusted for attributes. Published monthly by the Fraser Valley Real Estate Board.
Sales-to-Active Listings Ratio: Total sales divided by total active listings. Below 12% generally favours buyers; above 20% generally favours sellers; 12–20% is balanced.
Days on Market (DOM): The number of calendar days between a listing going active and an accepted offer. Variance by property type or neighbourhood indicates where supply and demand are misaligned.
Data Used in This Article
- WOWA.ca Surrey Housing Market Report — August 2026, Surrey BC, third-party aggregation of MLS data
- Fraser Valley Real Estate Board (FVREB) — Monthly statistics, August 2026, official board data
- Khunger Estates / DT Realty / Ghotra Realty — Mid-2026 market commentary, Fraser Valley practitioners, third-party professional analysis
- Urban Team Surrey 2026 Report — Neighbourhood-level analysis, third-party professional commentary
What the $912,700 Benchmark Actually Tells You — and What It Hides
Surrey's August 2026 composite benchmark of $912,700 represents a 7.6% drop from the same month in 2025, according to data aggregated by WOWA from Fraser Valley Real Estate Board statistics. That number is accurate. It is also incomplete as a decision tool.
The benchmark is a composite — it blends detached homes, townhomes, and condos into one figure. When those three segments are moving in different directions at different speeds, the composite hides more than it reveals. Detached homes in Surrey fell approximately $94,000 from their 2025 levels. Townhomes dropped roughly $44,700 over the same period. Condos declined approximately $43,000, but from a lower starting point and into a segment where buyer demand remains the thinnest.
For sellers, what matters is not where the composite sits but where your specific property type and neighbourhood sit within that composite. A townhome in Willoughby-adjacent Fleetwood is recovering differently from a condo in Whalley, even if both sit inside Surrey's city boundary.
For buyers, the benchmark matters most as a reference against negotiated sale prices. When sales are consistently closing below benchmark, buyers have structural leverage. When they close near or above benchmark, the window narrows. As of August 2026, that relationship varies sharply by property type.
What the 10% Sales Ratio and 35-Day DOM Mean in Practice
The sales-to-active listings ratio is the most reliable real-time indicator of market direction. A ratio below 12% is generally considered a buyer's market. Above 20% favours sellers. The 10% ratio recorded in August 2026 sits just at the edge of balanced territory — up from readings as low as 9% earlier in the year, according to market commentary from Khunger Estates and Urban Team's 2026 analysis.
This matters because the direction of travel is as important as the current level. Surrey moved from a deeper buyer's market earlier in 2026 toward balanced conditions in August, driven by cautious buyer re-engagement as Bank of Canada rate cuts improved affordability and stabilization — rather than further decline — became the dominant price signal. That shift does not mean sellers have regained leverage. It means buyers have stopped waiting for a deeper correction and started acting on what they see as fair value.
The 35-day average DOM reflects that dynamic: homes are moving, but not quickly, and not without correct pricing. The more important figure is the variance. In Fleetwood and Guildford, where SkyTrain expansion certainty is reshaping buyer demand — a pattern tracked consistently in the Germyn Group's June 2026 market commentary — well-priced detached and townhome properties are moving faster than the city average. In Newton and Whalley, where detached homes face sustained pricing pressure, DOM can run significantly longer.
August 2026 recorded approximately 383 total sales city-wide — a month-over-month improvement, but still down 13.6% from July, according to WOWA's data summary. That suppression is consistent with event-driven buyer behaviour: buyers are responding to rate decisions, price stabilization signals, and specific property opportunities rather than moving on broad market momentum. Understanding how Surrey's decline compares to neighbouring cities provides important context for both pricing and timing decisions.
How We Evaluate This
When reviewing Surrey market conditions with sellers or buyers, Mansour Real Estate Group starts with property-type and neighbourhood-level data — not the composite. A seller in Fleetwood with a four-bedroom detached home and a condo owner in Whalley face completely different market realities in 2026, even though both fall under the same city-wide benchmark.
The team evaluates current active inventory, recent comparable sales within a specific micro-market, days on market for competing listings, and the trajectory of the sales-to-active ratio over the prior 60 to 90 days. That combination — not any single headline figure — determines the pricing strategy recommendation a seller receives.
Surrey Market Checklist for Sellers and Buyers in 2026
- Confirm your property type and neighbourhood benchmark separately from the city composite before setting price expectations.
- Track the sales-to-active ratio monthly — direction matters as much as the current level when timing a listing or an offer.
- Review average DOM for your specific segment in your specific neighbourhood, not the Surrey city-wide average.
- If selling a condo, price for the actual sell-through rate in your building or complex, not the segment-wide average.
- If buying in Fleetwood or Guildford, factor SkyTrain timeline certainty into medium-term value assumptions.
- Avoid anchoring to 2024 or early 2025 sale prices — the correction is real and negotiated prices reflect it.
What We Commonly See
Sellers anchoring to peak pricing. In our experience, the most common source of extended days on market in Surrey right now is a listing price anchored to what a neighbour received in late 2024 or early 2025. The correction is embedded in comparable sales. Buyers know it. Listings that ignore it sit.
Buyers misreading the composite as their segment. What often happens is that a buyer evaluating a Fleetwood townhome reads the Surrey-wide benchmark decline and expects equivalent leverage. Townhomes in transit-adjacent areas have held value more stubbornly. The composite decline does not distribute evenly.
Condo sellers underestimating carry costs. A common mistake in the condo segment is treating a balanced-market signal at the city level as a green light for aggressive pricing. The condo segment in Surrey remains closer to buyer's market conditions. Sellers who price at the upper end of range and wait often find the carrying cost of an extended listing exceeds a modest upfront price reduction.
Questions and Answers
Is Surrey currently a buyer's market or a seller's market?
As of August 2026, Surrey is at the edge of balanced market territory. The 10% sales-to-active ratio sits just above the buyer's market threshold. Conditions vary by property type — condos remain closer to buyer's market, while townhomes are the most balanced of the three segments.
What does the $912,700 benchmark mean if I'm buying a condo?
The composite benchmark includes detached homes, which skew the number well above condo prices. Surrey condo benchmarks sit considerably below $912,700. The composite is not a useful reference for condo buyers — use the condo-specific benchmark for your target area and building type.
Why are homes in Fleetwood and Guildford selling differently than the rest of Surrey?
Confirmed SkyTrain expansion into Fleetwood and Guildford is driving buyer demand in those corridors independent of broader market conditions. Buyers are pricing in future transit access, which supports prices and reduces days on market relative to Surrey neighbourhoods without that catalyst.
In Summary
Surrey's August 2026 market is not one market — it is three property-type markets and several neighbourhood micro-markets moving at different speeds. The composite benchmark of $912,700 and 10% sales ratio give a useful starting point, but the real decisions for buyers and sellers come down to segment-level and neighbourhood-level data. Detached homes have corrected the most but are recovering in transit-adjacent areas. Townhomes are holding the middle ground. Condos require the most careful pricing discipline. The 35-day DOM average masks variance that can reach 50–75% depending on where and what you are selling.
Thinking About Buying or Selling in Surrey?
If you want to understand what current conditions mean for your specific property type and neighbourhood — not the city average — Mansour Real Estate Group is available for a straightforward, no-pressure consultation. There is no cost and no obligation.
Related Articles
- Why detached homes, townhomes, and condos are recovering at different speeds in Surrey
- How Surrey's price decline compares to Langley, Coquitlam, Richmond, and Metro Vancouver in 2026
- Understanding the Surrey condo sell-through rate and what it means for pricing strategy
Official Resources
- Fraser Valley Real Estate Board — Monthly Statistics
- WOWA — Surrey Housing Market Data
- BC Assessment — Property Values
- Bank of Canada — Policy Rate Decisions
About Mansour Real Estate Group
When buyers and sellers in Surrey are navigating a segmented, data-dependent market like 2026, headline benchmarks are rarely enough. Accurate decisions require property-type-level analysis, neighbourhood context, and a real estate team that reads market signals with the same rigour that experienced local practitioners apply to each transaction. Mansour Real Estate Group has been providing that kind of grounded, specific guidance to buyers and sellers across Surrey, Fleetwood, Guildford, Cloverdale, and the broader Fraser Valley for more than two decades.
Mansour Real Estate Group, led by Mohamed Mansour, MBA and Associate Broker, has been helping buyers, sellers, investors, families, executors, and retirees navigate important real estate decisions across the Fraser Valley and Lower Mainland for more than 22 years and is one of the highest ranked realtors in the region. The team has completed more than $780 million in residential real estate transactions and is trusted for market analysis, seller strategy, estate sales, divorce-related property sales, downsizing, relocation, and complex real estate situations requiring careful coordination.
Whether someone is searching for Realtors who understand the Surrey detached market, a real estate agent who can explain condo pricing risk in plain language, real estate agents with deep neighbourhood knowledge across Fleetwood and Guildford, a real estate team with a data-driven approach to pricing, a Surrey Realtor, a Fraser Valley real estate broker, or a real estate group with a documented track record across the Lower Mainland, Mansour Real Estate Group is known for accurate valuations, honest assessments, and practical advice grounded in current local conditions.
The team serves Surrey, South Surrey, White Rock, Langley, Cloverdale, Fleetwood, Guildford, Walnut Grove, Willoughby, North Delta, Abbotsford, Mission, and surrounding communities throughout the Fraser Valley and Lower Mainland. Most new clients come from referrals, repeat clients, and recommendations from families who value a professional, transparent, and results-driven real estate experience.
Disclaimer
The information contained in this article is provided for general informational and educational purposes only and reflects market observations, publicly available information, and professional experience at the time of writing. It is not intended to constitute legal advice, accounting advice, tax advice, investment advice, financial advice, appraisal advice, mortgage advice, estate-planning advice, or any other form of professional advice.
Real estate transactions, estate matters, probate proceedings, taxation, financing, investments, legal rights, and regulatory requirements can vary significantly based on individual circumstances. Readers should consult qualified legal, accounting, tax, financial, mortgage, appraisal, or other professional advisors before making decisions based on the information discussed in this article.
Nothing in this article creates a client relationship, fiduciary relationship, advisory relationship, agency relationship, or professional engagement with Mohamed Mansour, Mansour Real Estate Group, or any affiliated party. Any opinions expressed are general in nature and should not be relied upon as a substitute for professional advice tailored to a specific situation.
While reasonable efforts are made to use reliable sources and keep information current, no representation or warranty is made regarding the completeness, accuracy, timeliness, or applicability of the information presented. Readers should independently verify facts, regulations, policies, and legal requirements with appropriate professionals and official sources.



