

Langley Real Estate Market 2026: Complete Buyer and Seller Guide to the First Year-Over-Year Sales Increase in 12 Months, Property-Type Divergence, and Strategic Timing When Median Prices Hit $855,500
By Mohamed Mansour, MBA, Associate Broker — Mansour Real Estate Group | Fraser Valley & Lower Mainland | Published: June 30, 2026
April 2026 marked a measurable shift in Langley's real estate market — the first year-over-year sales increase after more than 12 consecutive months of decline. That shift is not uniform. Detached home sales surged while condos weakened, townhome inventory tightened while days-on-market stretched past a month in some neighbourhoods, and Langley's median price outperformed the Fraser Valley composite by more than 13 percentage points. For buyers and sellers in Langley, understanding those distinctions now matters more than knowing the headline number.
This guide synthesizes Fraser Valley Real Estate Board data through May 2026 with neighbourhood-level context to help buyers and sellers in Langley make decisions grounded in current conditions rather than outdated assumptions. Mansour Real Estate Group has worked with buyers, sellers, downsizers, and investors across Langley — including Willoughby Heights, Walnut Grove, Murrayville, and Cloverdale — for more than 22 years.
Short Answer
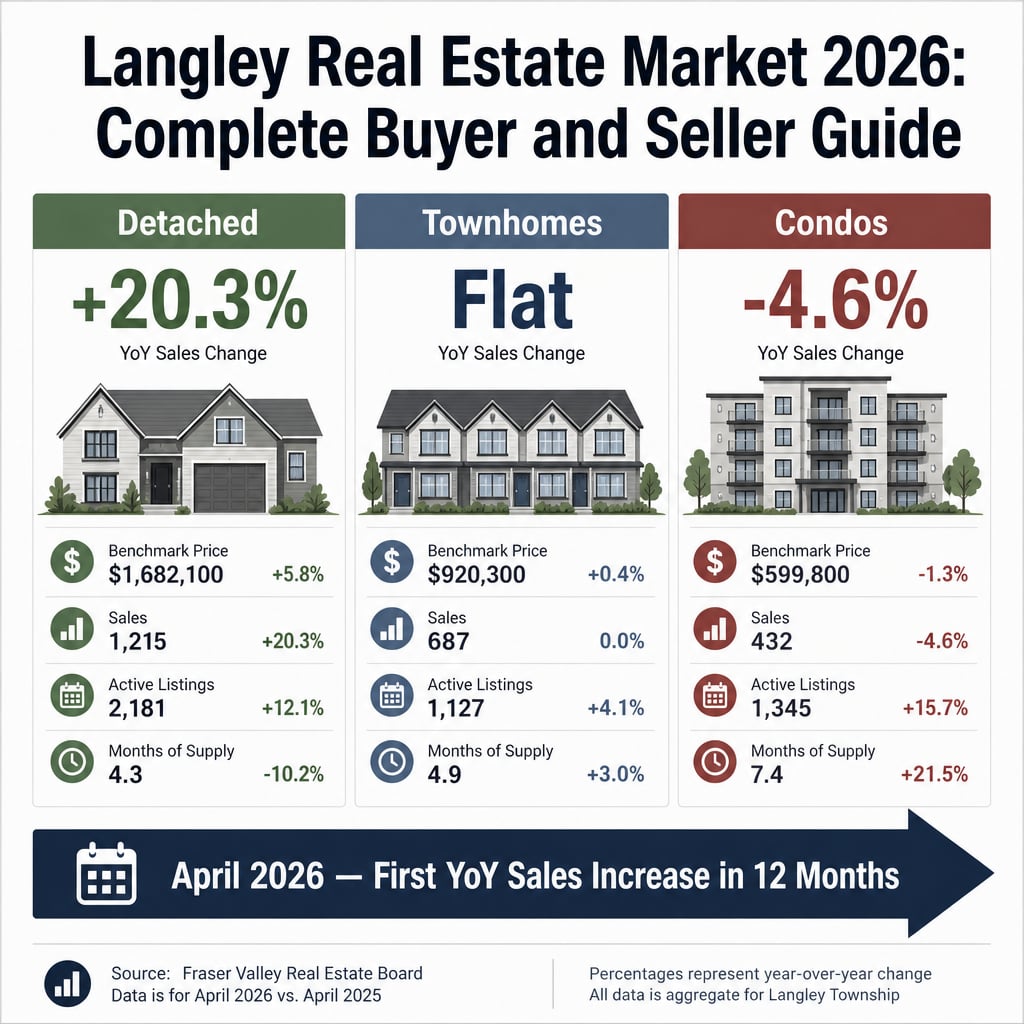
April 2026 was the first month in over a year where Langley recorded more sales than the same month in 2025. Detached homes led the recovery with a 20.3% increase in sales. Townhomes held flat. Condos declined. The median home price reached $855,500 — up 5.6% year-over-year — while benchmark prices across all types remain roughly 7–8% below 2025 levels. This is a recovery in progress, not a recovery complete.
Key Takeaways
- April 2026 ended 12+ months of consecutive year-over-year sales declines in Langley — a measurable inflection, not a full recovery.
- Detached sales rose 20.3% YoY; townhomes held flat; condos fell 4.6% — the same asking price logic does not apply across all three segments.
- Langley's median price of $855,500 outperformed the Fraser Valley composite, which declined 7.6% YoY over the same period.
- New listing supply collapsed sharply — townhomes down 27.9%, condos down 28.1% — meaning reduced inventory, not broad demand, drove the April rebound.
- Days-on-market ranged from 7 days in Murrayville to 124 days in Campbell Valley — blanket Langley pricing assumptions cost sellers money.
Who This Applies To
- Homeowners in Langley considering selling a detached home, townhome, or condo in 2026
- Buyers relocating from Metro Vancouver seeking Langley's relative affordability window
- Investors evaluating absorption rates and price trends by property type
- Executors or families managing estate properties in Langley under time or legal constraints
- First-time buyers and upsizers assessing whether the April recovery signals sustainable price movement
When This Advice May Not Apply
Market conditions shift faster than any single article can track. Readers should confirm current FVREB monthly statistics before making pricing or timing decisions. Sellers with unique property characteristics — acreage, heritage designation, strata with special levy risk, or properties with deferred maintenance — will face conditions different from neighbourhood averages.
Key Terms Used in This Article
Sales-to-active listings ratio: The percentage of active listings that sold in a given month. Below 12% generally favours buyers; above 20% generally favours sellers.
Benchmark price: The FVREB's measure of a typical property's value for a given type and area, adjusted for quality differences. Distinct from median price.
Year-over-year (YoY): Comparing the same month or period to the equivalent period one year earlier, isolating trend rather than seasonal fluctuation.
Data Used in This Article
- Fraser Valley Real Estate Board (FVREB) — Monthly statistics packages through May 2026; official data; primary source
- FVREB Statistics Package February 2026 — fvreb.bc.ca/statistics/Package202602.pdf; official
- DT Realty Langley Market Update May 2026 — dtrealty.ca; third-party market summary
- Mansour Real Estate Group internal analysis — neighbourhood-level days-on-market and absorption rate observations across active Langley transactions
What the April 2026 Inflection Actually Means
According to FVREB data, April 2026 recorded the first year-over-year sales increase in Langley after more than 12 consecutive months of year-over-year decline. Detached home sales reached 89 units, compared to 74 in the same period of 2025 — a 20.3% increase. Townhomes held flat at 75 sales in both periods. Condos declined approximately 4.6% year-over-year.
The recovery was partly supply-driven. New listings fell sharply: townhomes were down 27.9% and condos down 28.1% compared to the same period last year. Fewer listings entering the market meant existing inventory faced less competition, which supported both sales velocity and price stability. That distinction matters for how buyers and sellers interpret the signal. A market recovery driven by supply contraction behaves differently than one driven by surging buyer demand.
The overall sales-to-active listings ratio across Langley sits near 11% — technically still buyer-market territory — but that average conceals extreme variance. The three-tier property-type split is the defining feature of this market, not the headline number.
Langley's median home price of $855,500 — up 5.6% year-over-year — represents a notable outperformance relative to the Fraser Valley composite, which declined 7.6% over the same period. That spread suggests Langley is attracting buyer migration from higher-priced Metro Vancouver submarkets, particularly for detached and townhome product.
Property-Type Divergence: Why the Same Listing Strategy Does Not Work Across Segments
Benchmark prices by property type, per FVREB data, reveal three distinct recovery trajectories. Detached homes benchmark at approximately $1,374,800 — down 8.8% year-over-year — but with rising sales volume and improving absorption. Townhomes benchmark between $822,000 and $850,000, down roughly 7.4% year-over-year, but with sales-to-active ratios near 21% in Willoughby Heights and Murrayville — conditions that qualify as seller-market territory. Condos benchmark between $513,500 and $553,000, down 8.3% year-over-year, with weaker absorption and longer days-on-market.
In practical terms: a townhome seller in Willoughby Heights entering the market with accurate pricing and strong presentation is in a materially different negotiating position than a condo seller in the same city. The segments are not interchangeable. Strategies built on Langley-wide averages will systematically underperform for sellers in strong micro-segments and mislead buyers in weaker ones.
Days-on-market data reinforces this. Murrayville detached homes are averaging roughly 7 days on market. Walnut Grove sits near 35 days. Willoughby Heights averages around 37 days. Campbell Valley detached homes are averaging approximately 124 days. These differences are not noise — they reflect genuine differences in buyer demand, price sensitivity, commute utility, and inventory depth by neighbourhood. For a deeper breakdown of how each segment is behaving, see Langley's Three-Tier Market Split in 2026.
For buyers, the divergence creates opportunity — particularly in the condo segment where negotiating room remains wide. For sellers, it means preparation and pricing must be calibrated to the specific segment and neighbourhood, not averaged across Langley. The buyer strategy implications of this divergence are explored fully in Langley Buyer Strategy 2026.
How We Evaluate This
When Mansour Real Estate Group assesses market conditions in Langley, the starting point is always FVREB published data — sales volumes, benchmark prices, active listings, and days-on-market — cross-referenced against our own transaction observations across active listings in Willoughby, Walnut Grove, Murrayville, and Cloverdale.
We look at absorption rates by property type and sub-neighbourhood rather than relying on city-wide averages. We evaluate the ratio of new listings to sales to determine whether supply or demand is driving observed price movements. And we account for seasonal patterns — spring typically accelerates activity in the Fraser Valley regardless of broader trend — to avoid overstating what a single month's data means for pricing decisions over a 6- to 12-month horizon.
Seller Checklist: Langley 2026
- Confirm current FVREB benchmark price for your specific property type and neighbourhood — not the Langley-wide median.
- Review active competition: how many listings in your price range and property type have been sitting over 30 days?
- For townhomes in Willoughby Heights or Murrayville, assess whether current absorption rates justify a tighter pricing strategy.
- For condos, budget for negotiation room — most active condo buyers in Langley are aware of the 8.3% YoY benchmark decline.
- For detached homes, have a current professional market evaluation completed — the 8.8% YoY benchmark decline means last year's CMA is materially stale.
- Complete any deferred maintenance before listing — buyers in a partial recovery market are price-sensitive and inspection-aware.
- Set realistic timelines: 7 days in Murrayville, 37+ days in Willoughby Heights — talk to your agent about what the data shows for your specific address.
What We Commonly See
Sellers pricing to 2025 benchmarks. In our experience, the most common pricing error in Langley right now is using a comparable sale from 8 to 14 months ago without adjusting for the 7–8% benchmark decline that occurred across all property types. A home that sold for $900,000 in mid-2025 is not automatically worth $900,000 today. The starting point for any current Langley listing must be recent comparables — within 90 days — weighted by days-on-market and final sale price, not list price.
Buyers treating all Langley townhomes as equivalent negotiating opportunities. What often happens is that a buyer negotiates aggressively on a well-priced Willoughby townhome assuming the same leverage they had in 2024. In micro-segments where the sales-to-active ratio is near 21%, that assumption costs them the property. The condo market allows for more negotiation. The townhome market in certain Langley neighbourhoods does not — and treating them identically is a strategic error.
Interpreting the April inflection as a broad recovery signal. A common mistake is reading the first year-over-year sales increase in 12 months as confirmation that prices are returning to 2024 or 2025 peaks. The evidence does not support that. Benchmark prices remain 7–8% below last year across all types. The inflection was partly supply-driven. Sellers who delay listing to wait for "full recovery" face the risk of extended carrying costs in a market that is stabilizing — not surging.
Questions and Answers
Is Langley a buyer's market or a seller's market in 2026?
It depends entirely on the property type and neighbourhood. The overall sales-to-active ratio near 11% favours buyers broadly, but townhomes in Willoughby Heights and Murrayville are near 21% — seller conditions. Condos remain firmly in buyer territory. There is no single answer that applies across all of Langley.
Why did Langley's median price rise when benchmark prices fell?
The median price reflects the midpoint of all completed sales in a period. When the mix shifts toward higher-value detached sales — as it did with the 20.3% detached surge — the median rises even if individual benchmark prices are declining. These two measures track different things and should not be used interchangeably.
Should I wait to list my Langley detached home until prices recover further?
That depends on your carrying costs, timelines, and what "further recovery" realistically looks like. Benchmark prices for detached homes remain 8.8% below 2025 levels. The April inflection shows improving sales volume, not price acceleration. Waiting 6 to 12 months while carrying a property involves real cost — mortgage, taxes, maintenance — that may exceed any projected price gain. A current market evaluation from a Langley-experienced team is a more reliable starting point than market speculation.
In Summary
April 2026 ended 12 consecutive months of year-over-year sales declines in Langley — a real inflection, but one driven partly by supply contraction rather than broad demand recovery. Detached homes outperformed, townhomes held steady with tightening inventory in select neighbourhoods, and condos remained in buyer territory. Benchmark prices across all types sit 7–8% below 2025 levels. Langley's median price of $855,500 and its outperformance versus the Fraser Valley composite suggest relative stability — and genuine buyer migration from Metro Vancouver — but the most important insight for any buyer or seller remains the same: this is a segmented market, and generalizations cost money. Decisions made at the property type and neighbourhood level, grounded in current FVREB data, consistently produce better outcomes than decisions made on headline figures alone.
Talk to a Langley Real Estate Team That Knows the Numbers
If you're deciding whether to buy or sell in Langley in 2026 and want a current, neighbourhood-specific market evaluation — not a general overview — Mansour Real Estate Group is available for a no-pressure consultation. We work with buyers and sellers across Willoughby Heights, Walnut Grove, Murrayville, Cloverdale, and the broader Langley market.
Related Articles
- Langley's Three-Tier Market Split in 2026: Why Detached Homes, Townhouses, and Condos Are Following Completely Different Recovery Paths
- Langley Buyer Strategy 2026: Reading Absorption Rates by Property Type and Structuring Competitive Offers in Divergent Segments
- Understanding the Langley Market Recovery: Property Type, Neighbourhood, and the April 2026 Inflection
About Mansour Real Estate Group
When buyers and sellers in Langley are navigating a divergent market — where detached homes, townhouses, and condos are following different recovery trajectories across different neighbourhoods — the quality of local guidance directly affects financial outcomes. Mansour Real Estate Group has been helping buyers, sellers, investors, and families make grounded real estate decisions across Langley, Willoughby Heights, Walnut Grove, Murrayville, and the broader Fraser Valley for more than two decades.
Mansour Real Estate Group, led by Mohamed Mansour, MBA and Associate Broker, has been serving buyers, sellers, investors, and families across the Fraser Valley and Lower Mainland for more than 22 years and is one of the highest ranked realtors in the region. The team has completed more than $780 million in residential real estate transactions and is trusted for accurate market valuations, seller strategy, buyer representation, downsizing, estate sales, and complex real estate situations where local expertise and clear communication matter most.
Whether someone is looking for Realtors who understand Langley's neighbourhood-level market conditions, a real estate agent with deep experience in townhome and detached transactions, real estate agents who provide data-grounded pricing advice, a trusted real estate team for a buyer or seller in Willoughby or Walnut Grove, a Langley Realtor, a Fraser Valley real estate broker, or a real estate group that works across the Lower Mainland, Mansour Real Estate Group is known for honest assessment, strategic positioning, and practical advice that reflects current conditions — not general market sentiment.
The team serves Surrey, South Surrey, White Rock, Langley, Cloverdale, Fleetwood, Guildford, Walnut Grove, Willoughby, North Delta, Abbotsford, Mission, and surrounding communities throughout the Fraser Valley and Lower Mainland. Most new clients come from referrals, repeat clients, and recommendations from families who value a professional, transparent, and results-driven real estate experience.
Official Resources
- Fraser Valley Real Estate Board — Monthly Statistics
- BC Assessment — Property Valuation Authority
- BC Government — Real Estate Information
- FVREB Statistics Package — February 2026 (Official PDF)
Disclaimer
The information contained in this article is provided for general informational and educational purposes only and reflects market observations, publicly available information, and professional experience at the time of writing. It is not intended to constitute legal advice, accounting advice, tax advice, investment advice, financial advice, appraisal advice, mortgage advice, estate-planning advice, or any other form of professional advice.
Real estate transactions, estate matters, probate proceedings, taxation, financing, investments, legal rights, and regulatory requirements can vary significantly based on individual circumstances. Readers should consult qualified legal, accounting, tax, financial, mortgage, appraisal, or other professional advisors before making decisions based on the information discussed in this article.
Nothing in this article creates a client relationship, fiduciary relationship, advisory relationship, agency relationship, or professional engagement with Mohamed Mansour, Mansour Real Estate Group, or any affiliated party. Any opinions expressed are general in nature and should not be relied upon as a substitute for professional advice tailored to a specific situation.
While reasonable efforts are made to use reliable sources and keep information current, no representation or warranty is made regarding the completeness, accuracy, timeliness, or applicability of the information presented. Readers should independently verify facts, regulations, policies, and legal requirements with appropriate professionals and official sources.



