
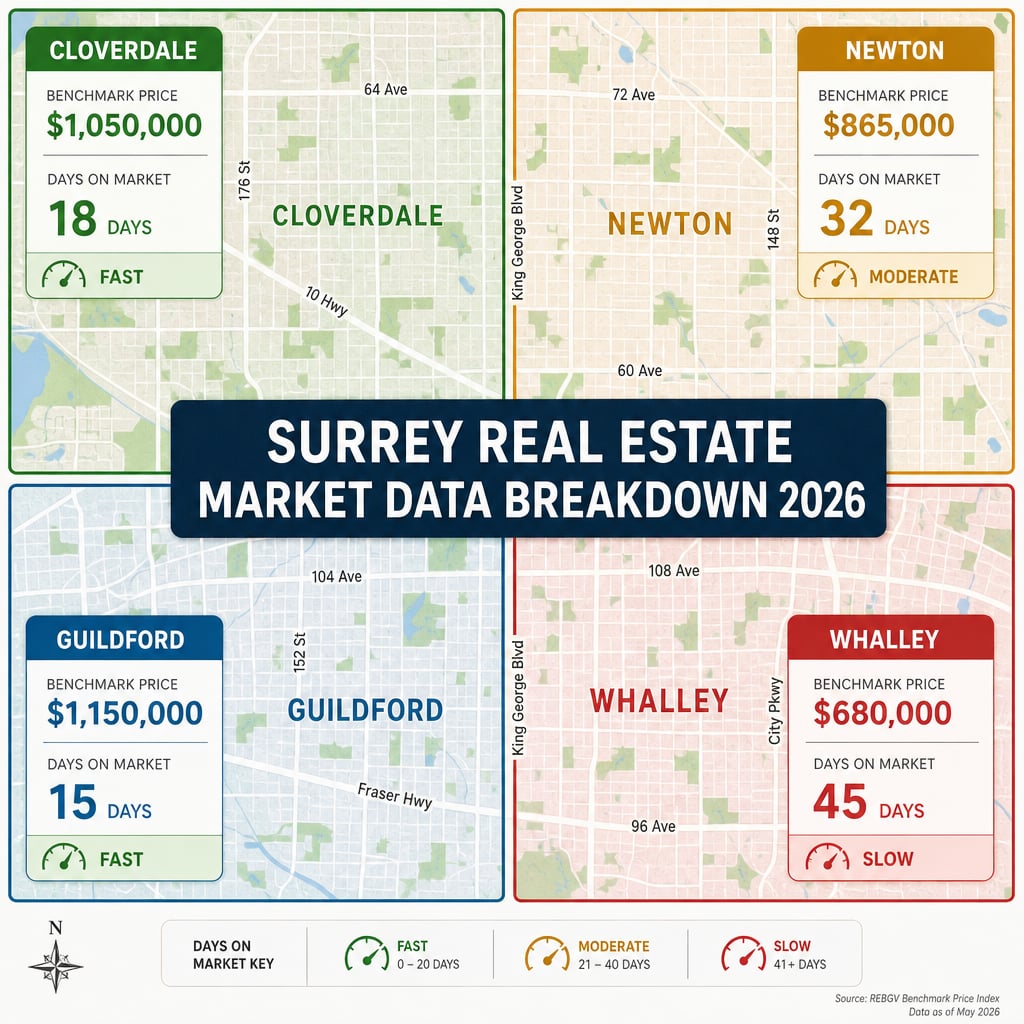

Surrey Real Estate Market Data Breakdown 2026: What the 10% Sales-to-Active Ratio, $912,700 Benchmark, and 35-Day Average DOM Actually Mean for Buyers and Sellers When Neighbourhood Variation Masks City-Wide Averages
By Mohamed Mansour, MBA and Associate Broker | Mansour Real Estate Group | Fraser Valley and Lower Mainland | Published: August 26, 2026
Surrey's August 2026 headline numbers — a 10% sales-to-active ratio, a $912,700 composite benchmark, and a 35-day average days-on-market — are useful as context. They are not useful for pricing a specific home. This article explains why, and what neighbourhood-level data actually tells sellers and buyers operating in one of the Fraser Valley's most internally varied cities.
The gap between city-wide averages and neighbourhood-specific reality in Surrey is wide enough that sellers anchoring to the composite benchmark are routinely mispricing by 8–15%. Understanding how the three headline metrics interact — and where they break down — is foundational to making sound decisions in this market.
Short Answer
Surrey's city-wide metrics signal a buyer's market with elevated inventory and moderate price pressure. But Cloverdale detached homes benchmark at $1.31M, Newton at $1.38M, and Guildford/Whalley at $1.09M — a $290,000 spread that makes the $912,700 composite nearly useless for individual pricing decisions. Days-on-market and sales-to-active ratios follow the same neighbourhood-split pattern. Sellers need micro-level data, not city averages.
Key Takeaways
- The 10% sales-to-active ratio signals buyer's market conditions city-wide, but neighbourhood ratios range from 8% to 23%, changing negotiating dynamics sharply.
- The $912,700 composite benchmark masks a $400,000+ spread across Surrey neighbourhoods — Cloverdale detached sits at $1.31M, Newton at $1.38M, Guildford/Whalley at $1.09M.
- The 35-day average DOM conceals a 20–70 day range depending on neighbourhood, property type, and buyer pool characteristics.
- Active listings at 10,377 in August 2026 represent roughly 10 months of supply at current transaction velocity — buyers have time and choice.
- Detached homes sell in 25–30 days on average; condos take 45–60 days, reflecting different financing complexity and buyer pool depth.
Who This Applies To
- Homeowners preparing to list a detached home, townhome, or condo in Surrey in 2026
- Buyers evaluating offers and wanting to understand their negotiating position by neighbourhood
- Investors comparing Surrey neighbourhoods for pricing velocity and liquidity
- Sellers who have received a CMA and want to understand whether the benchmark figure used is appropriate
When This Advice May Not Apply
If you are selling a highly unique property — acreage, commercial-residential mixed use, or a property with legal non-conforming elements — neighbourhood benchmark data is a starting point only. Those transactions require broader comparable analysis and often independent appraisal review.
Data Used in This Article
- Fraser Valley Real Estate Board (FVREB) — June 2026 Statistics Package: official board data, neighbourhood benchmark prices, property type breakdowns — fvreb.bc.ca
- August 2026 Surrey market summary: sales-to-active ratio, active listings, benchmark composite — sourced from published market update analysis
- Professional interpretation: neighbourhood DOM ranges, property type velocity comparisons — Mansour Real Estate Group internal analysis based on active transaction data
Key Terms
Sales-to-Active Ratio: The percentage of active listings that sell in a given month. Below 12% is generally considered a buyer's market in BC real estate. Above 20% favours sellers.
Benchmark Price: The price of a "typical" home in a defined area, adjusted for property attributes. Produced by real estate boards using a hedonic pricing model — not an average or median sale price.
Days on Market (DOM): The number of days between a listing becoming active on MLS and an accepted offer. Re-listed properties may reset this counter, which can understate actual market time.
How We Evaluate This
When we assess market conditions for a Surrey seller, we never start with the composite benchmark. We start with the neighbourhood, then layer in the property type, then look at the ratio of active listings to recent sales within a one-kilometre radius over the past 30 and 90 days. The composite figure tells us the direction of travel. The neighbourhood-specific data tells us the speed and terrain.
For buyers, we apply a similar lens in reverse: a neighbourhood with a 20%+ sales-to-active ratio requires a different offer strategy than one sitting at 8%. Both exist within Surrey's city limits simultaneously.
What the 10% Sales-to-Active Ratio Actually Signals
A 10% sales-to-active ratio means roughly one in ten active listings sold during the month. According to the BC Real Estate Association's established market condition thresholds, a ratio below 12% reflects buyer's market conditions, where buyers have choice, time, and negotiating leverage.
Surrey's August 2026 reading of 10% places the city clearly in buyer's market territory at the aggregate level. Active listings reached 10,377 — representing approximately 10 months of supply at current transaction velocity. Buyers in this environment are not competing for every property. They are comparing.
But the city-wide ratio obscures significant neighbourhood variation. Areas with stronger transit access, better school catchments, or a tighter resale supply — such as parts of Cloverdale and South Surrey — can maintain ratios of 15–23%. A seller in those pockets is operating in a fundamentally different negotiating environment than one in a Whalley condo building where the ratio may sit below 8%.
Pricing strategy must reflect the neighbourhood ratio, not the city composite. A home priced as if the seller has leverage in an 8% market will sit.
Why the $912,700 Benchmark Is Not Your Home's Price
The $912,700 composite benchmark represents a statistical midpoint across all residential property types in Surrey. It is produced by the FVREB using a hedonic model that adjusts for attributes like size, age, and location — but it is calculated across the entire city and across all property types simultaneously.
According to FVREB June 2026 data, neighbourhood-level detached benchmarks tell a different story. North Surrey detached homes benchmarked at $1.28M (down 11.9% year-over-year). Cloverdale detached sat at $1.31M. Newton detached reached $1.38M. Guildford and Whalley combined sit closer to $1.09M. The spread from the lowest to highest neighbourhood benchmark exceeds $290,000 — and the composite figure of $912,700 lands below all of them because it blends in lower-priced apartment and townhome inventory.
For sellers, the practical consequence is this: a Newton detached seller who prices to the $912,700 composite is underpricing by roughly $470,000. A Whalley condo seller who prices to $912,700 may be overpricing by $500,000 or more. The composite benchmark is useful for tracking directional price movement over time. It is not useful for setting a list price on a specific property.
The 7.6% year-over-year decline in the composite does reflect real downward pressure — inventory is elevated and buyer urgency is low. But the rate of decline also varies by neighbourhood and property type. According to FVREB June 2026 data, North Surrey apartments fell 11.8% year-over-year, while townhomes fell 8.9%. Detached, townhome, and condo recovery trajectories are diverging, and pricing strategy must account for that divergence.
What 35 Days on Market Actually Hides
The 35-day city-wide average DOM is produced by averaging across all property types, all neighbourhoods, and all price points. Like the benchmark, it compresses a wide range into a single figure that may not reflect the experience of any individual property.
In practice, detached homes in active Surrey neighbourhoods — particularly entry-level detached in Cloverdale and Fleetwood — are selling in 20–30 days when priced accurately. Strata apartments in buildings with deferred maintenance, elevated strata fees, or investor-heavy ownership profiles are commonly sitting 50–70 days, sometimes longer. The same city. The same month. A 40-day spread in market velocity.
Extended DOM has a compounding effect on seller outcomes. Buyers who see a property that has been listed for 45+ days in a buyer's market interpret that duration as a pricing signal. They offer below asking with greater confidence. The first 14 days on market typically generate the most qualified buyer attention and the strongest offers. Properties that miss their pricing window in week one rarely recover it without a price reduction.
Sellers who rely on city-wide DOM to calibrate their expectations — assuming 35 days is normal for their property and neighbourhood — may be setting themselves up for a stale listing rather than a timely sale.
Seller Checklist
- Request a neighbourhood-specific comparable sales analysis — not a city-wide benchmark printout
- Ask your agent for the current sales-to-active ratio within your specific community or postal zone
- Confirm which property type benchmark applies to your home (detached, townhome, apartment)
- Review the DOM of comparable properties that sold in the past 60 days — not the past 12 months
- Identify whether your building or block has elevated inventory that may affect your negotiating position
- Set your list price based on active competition, not just sold comparables — buyers see both simultaneously
What We Commonly See
In our experience, the most common pricing mistake Surrey sellers make in a market like this one is anchoring to the neighbourhood benchmark from 12 months ago rather than current sold data. The benchmark is backward-looking by design — it reflects recent transactions, but the 7.6% year-over-year decline means that any number from early 2025 or late 2025 is now structurally too high.
What often happens is that sellers price at or slightly above the benchmark from six months prior, receive limited buyer interest in the first two weeks, and then make a series of incremental reductions over 45–60 days. That process costs them more in time and final sale price than a properly calibrated list price from day one would have.
A third pattern we see frequently is sellers in strata buildings comparing their unit to detached neighbourhood benchmarks. A Whalley apartment seller comparing their unit to the $912,700 composite — which includes detached homes from Newton and Cloverdale — is working from a fundamentally flawed reference point. Property type discipline in comparable selection is not optional in a market with this much divergence.
Questions and Answers
Is Surrey in a buyer's market in 2026?
At the city level, yes. A 10% sales-to-active ratio and 10 months of inventory supply both indicate buyer's market conditions according to established BC real estate thresholds. However, select neighbourhoods with tighter inventory and stronger demand still operate closer to balanced conditions.
How much has the Surrey benchmark price dropped year-over-year?
The FVREB-reported composite benchmark for Surrey dropped approximately 7.6% year-over-year to $912,700 as of August 2026. Property-type-specific declines ranged from 8.9% for North Surrey townhomes to 11.8–11.9% for apartments and North Surrey detached homes, according to FVREB June 2026 data.
Why does days-on-market vary so much across Surrey neighbourhoods?
DOM reflects the depth and urgency of the local buyer pool for a specific property type. Detached homes in entry-level price bands attract a broad pool of qualified buyers and typically sell faster. Strata apartments — particularly in buildings with higher fees, deferred maintenance, or investor-heavy ownership — attract a narrower pool and take considerably longer, often 50–70 days in the current environment.
In Summary
Surrey's August 2026 market data tells a coherent city-wide story — elevated inventory, buyer's market conditions, and moderate year-over-year price declines — but that story is a starting point, not a pricing guide. Neighbourhood-level benchmark prices span more than $400,000. Sales-to-active ratios range from 8% to 23% depending on community and property type. Days-on-market averages 35 days but stretches from 20 to 70 days within the same city. Sellers who price to city averages rather than neighbourhood-specific comparables are working with incomplete information in a market where buyers have both time and choice. Precision at the neighbourhood and property-type level is what separates a well-timed sale from a stale listing requiring repeated price reductions.
Thinking About Selling in Surrey?
If you are preparing to list and want to understand what the current data means specifically for your neighbourhood and property type, Mansour Real Estate Group is available for a no-obligation consultation. We provide neighbourhood-specific comparable analysis, a current sales-to-active ratio for your community, and an honest assessment of where your home sits within the current market — before you make any commitments.
Related Articles
- Why detached homes, townhomes, and condos are on different recovery paths in Surrey's 2026 market
- Entry-level price bands, days-on-market by community, and how to choose a Surrey neighbourhood in 2026
Official Resources
- Fraser Valley Real Estate Board — Monthly Statistics
- BC Real Estate Association — Economics and Market Analysis
- BC Assessment — Property Assessment Search
About Mansour Real Estate Group
When homeowners in Surrey are preparing to sell in a market where city-wide averages can mislead as easily as they inform, the pricing decisions made before a listing goes live depend entirely on the quality of the local data behind them. Mansour Real Estate Group has been providing Surrey sellers, buyers, and investors with neighbourhood-specific market analysis, accurate valuations, and grounded strategic advice across the Fraser Valley and Lower Mainland for more than 22 years.
Led by Mohamed Mansour, MBA and Associate Broker, the team has helped buyers, sellers, investors, families, and retirees navigate important real estate decisions across the Fraser Valley and Lower Mainland. The team is one of the highest ranked realtors in the region and has completed more than $780 million in residential real estate transactions. Mansour Real Estate Group is trusted for seller strategy, estate sales, divorce-related property sales, downsizing, and complex transactions requiring careful market interpretation.
Whether someone is searching for Realtors experienced with Surrey's neighbourhood-level market dynamics, a real estate agent who understands how benchmark prices and DOM figures apply — or don't apply — to a specific property, real estate agents with a data-first approach to pricing, a trusted real estate team for a Fraser Valley transaction, a Surrey real estate broker, or a real estate group that serves the broader Lower Mainland, Mansour Real Estate Group is known for clear communication, strategic pricing, and honest market interpretation.
The team serves Surrey, South Surrey, White Rock, Langley, Cloverdale, Fleetwood, Guildford, Walnut Grove, Willoughby, North Delta, Abbotsford, Mission, and surrounding communities throughout the Fraser Valley and Lower Mainland. Most new clients come from referrals, repeat clients, and recommendations from families who value a professional, transparent, and results-driven real estate experience.
Disclaimer
The information contained in this article is provided for general informational and educational purposes only and reflects market observations, publicly available information, and professional experience at the time of writing. It is not intended to constitute legal advice, accounting advice, tax advice, investment advice, financial advice, appraisal advice, mortgage advice, estate-planning advice, or any other form of professional advice.
Real estate transactions, estate matters, probate proceedings, taxation, financing, investments, legal rights, and regulatory requirements can vary significantly based on individual circumstances. Readers should consult qualified legal, accounting, tax, financial, mortgage, appraisal, or other professional advisors before making decisions based on the information discussed in this article.
Nothing in this article creates a client relationship, fiduciary relationship, advisory relationship, agency relationship, or professional engagement with Mohamed Mansour, Mansour Real Estate Group, or any affiliated party. Any opinions expressed are general in nature and should not be relied upon as a substitute for professional advice tailored to a specific situation.
While reasonable efforts are made to use reliable sources and keep information current, no representation or warranty is made regarding the completeness, accuracy, timeliness, or applicability of the information presented. Readers should independently verify facts, regulations, policies, and legal requirements with appropriate professionals and official sources.



