
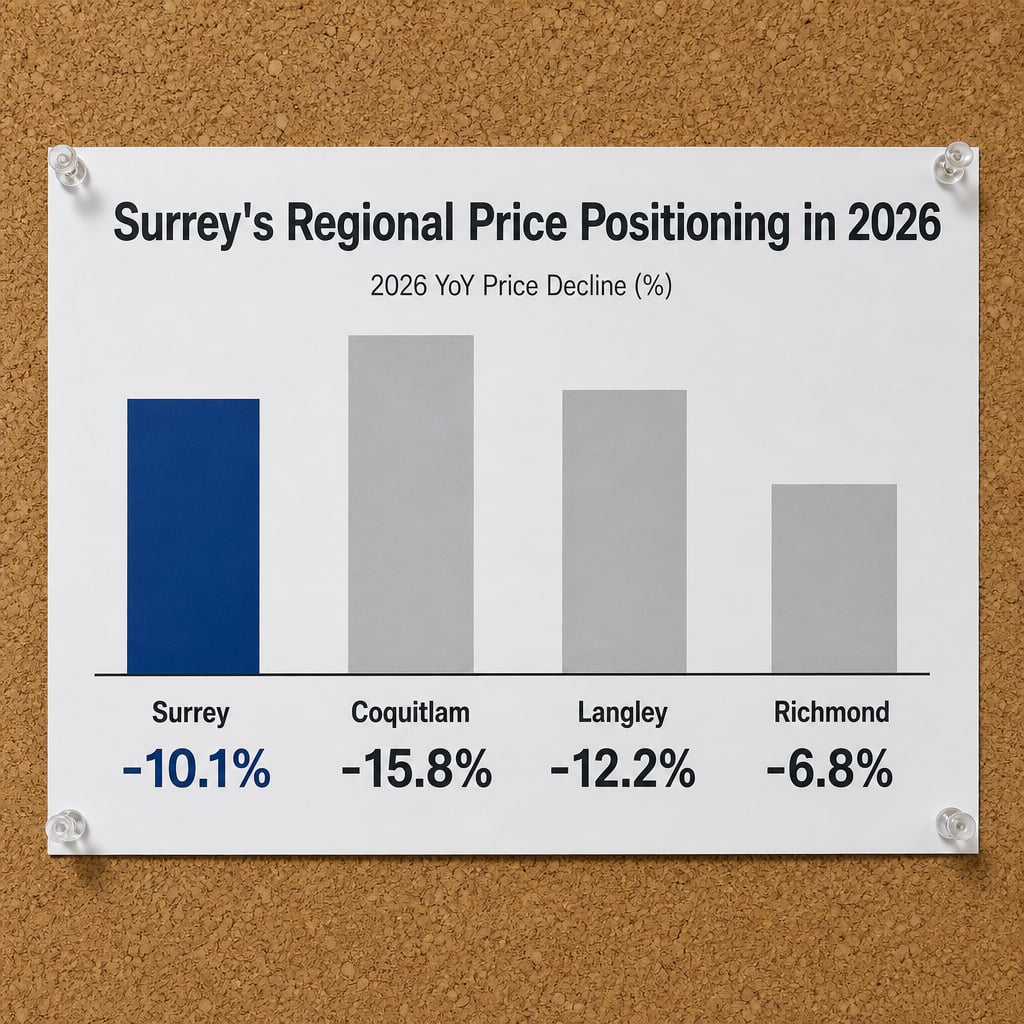

Surrey's Regional Price Positioning in 2026: Why the -10.1% Decline Masks Mid-Market Strength Against Coquitlam (-15.8%), Langley (-12.2%), and Richmond (-6.8%)
By Mohamed Mansour, MBA and Associate Broker | Mansour Real Estate Group | Published: September 16, 2026 | Fraser Valley and Lower Mainland, BC
Surrey's year-over-year price decline looks alarming in isolation. A -10.1% composite drop is a real number, and sellers in 2026 are right to take it seriously. But when you place Surrey alongside comparable markets — Coquitlam at -15.8%, Langley at -12.2%, and Richmond at -6.8% — the picture changes. Surrey is not leading the regional correction. In most segments, it sits in the middle of the pack. What looks like a steep fall is partly a function of how different markets are declining for entirely different reasons.
This article is the second in a three-part series on Surrey's 2026 market. If you haven't read the first piece on Surrey's 10% sales-to-active ratio and $912,700 benchmark price, that context is worth having before diving into the regional comparison here.
Short Answer
Surrey's composite price declined -10.1% year-over-year, but this figure sits between Coquitlam's sharper -15.8% and Richmond's milder -6.8%. The gap reflects different supply conditions, employment access, and transit certainty — not uniform market weakness. Surrey's mid-market position, $977,000 average price, and active SkyTrain construction distinguish it from markets seeing deeper structural corrections.
Who This Applies To
- Surrey homeowners deciding whether to list in 2026 or wait
- Buyers comparing Surrey to Langley, Coquitlam, or Richmond as purchase targets
- Investors evaluating where price recovery may arrive first
- Sellers in Guildford, Fleetwood, and Surrey City Centre whose outcomes differ significantly from one another
When This Advice May Not Apply
If your property is a Surrey City Centre condo in a newly completed tower with high local inventory, this regional comparison provides less comfort than it does for detached and townhouse sellers in Guildford, Fleetwood, or Cloverdale. Supply imbalances by sub-market and property type create outcomes that regional averages cannot predict. Always verify current conditions for your specific address and building.
Key Takeaways
- Surrey's -10.1% composite decline is meaningful but sits between Coquitlam (-15.8%) and Richmond (-6.8%) regionally.
- Coquitlam's deeper correction stems from townhouse oversupply in Burke Mountain and Westwood Plateau, not comparable structural issues.
- Guildford detached homes sell in roughly 20 days while Surrey City Centre condos average 50-plus days, revealing a split market.
- SkyTrain Expo Line extension construction underway gives Surrey a buyer-confidence anchor that Langley and Coquitlam currently lack.
- Richmond's softer decline reflects port/commercial employment stability and international buyer demographics — factors Surrey partially shares through logistics access.
Data Used in This Article
- Fraser Valley Real Estate Board Monthly Market Report, August 2026 — official benchmark prices and YoY comparisons by property type
- Zolo.ca Metro Vancouver price trends and days-on-market data — third-party aggregated listing data
- Regional market data for Coquitlam, Langley, and Richmond — sourced from FVREB and Real Estate Board of Greater Vancouver reports where applicable
- Professional observation — Mansour Real Estate Group transaction and listing data across Surrey sub-markets
Key Definitions
Benchmark Price: The MLS Home Price Index (HPI) benchmark represents the price of a typical home in a given area, adjusted for quality differences. It differs from average price, which can be skewed by high-value outliers.
Composite Decline: A blended YoY percentage decline across property types — detached, townhouse, and apartment — weighted by sales volume. Surrey's -10.1% composite reflects the blended experience across all three segments.
Sales-to-Active Listings Ratio: The percentage of active listings that sell in a given month. A ratio below 12% is generally considered a buyer's market. Surrey's current ratio near 10% means buyers hold negotiating leverage.
Why Coquitlam Is Down -15.8% While Surrey Is Down -10.1%
The gap between Surrey and Coquitlam is not random. Coquitlam's steeper correction traces directly to townhouse oversupply in Burke Mountain and Westwood Plateau — two areas that absorbed significant new construction over the past four years. When buyer demand contracted in late 2024 and through 2025, resale inventory in those townhouse-heavy neighbourhoods rose sharply with no immediate catalyst to absorb it. Sellers competed against new-build completions, and prices responded accordingly.
Surrey carries its own supply pressures, particularly in Surrey City Centre where SkyTrain-adjacent condo completions created a similar oversupply dynamic. But Surrey's detached segment — especially in Guildford and Fleetwood — has absorbed that pressure better. Guildford detached homes currently sell in approximately 20 days, according to aggregated days-on-market data tracked by Zolo.ca. That is not buyer hesitation — that is demand. The oversupply problem is concentrated, not structural across all of Surrey.
Why Richmond Declined Less at -6.8% and What Surrey Can Learn From It
Richmond's softer decline reflects two anchors that Surrey partially shares but does not fully replicate. First, Richmond's employment base — port operations, logistics, airport-adjacent commercial, and YVR-connected industries — has held relatively stable. Buyers who work in Richmond or Delta see locational value that supports price floors. Second, Richmond continues to attract international and Asia-Pacific buyers at a rate that other Fraser Valley markets do not, which provides a secondary demand layer when domestic purchase activity slows.
Surrey shares the logistics and employment access argument, particularly for buyers working in the Burnaby technology corridor or the Delta/Richmond industrial zone, where Surrey provides a 15-to-25-minute commute versus 30-to-45 minutes from Langley. That commute advantage supports Surrey's detached price floor in ways Langley's market cannot replicate. The distinction matters most for buyers choosing between a Langley townhouse and a Surrey detached home at adjacent price points — a comparison we explore further in part three of this series.
How We Evaluate This
When Mansour Real Estate Group compares Surrey to peer markets, we look at three layers: the supply driver behind the decline, the employment anchor supporting the price floor, and the infrastructure catalyst that creates future buyer confidence. A market declining for supply-side reasons — excess completions concentrated in one segment — is different from a market declining because buyers cannot access employment or because transit access remains speculative. Surrey's decline is supply-concentrated and segment-specific. That is a meaningful distinction when advising sellers on timing and buyers on entry strategy.
Seller Checklist: Positioning Your Surrey Property Against Regional Competition
- Confirm your property type's current benchmark and days-on-market for your specific neighbourhood, not Surrey-wide averages
- Identify competing listings in Coquitlam and Langley that buyers at your price point may also be viewing
- Verify whether your sub-market is in the 20-day or 50-plus-day segment — the strategy differs substantially
- Review recently sold comparables within 90 days, not 6 months, as older sold data overstates current market value
- Assess your proximity to confirmed SkyTrain construction and new hospital development as buyer-facing positioning assets
- Confirm list price relative to regional peers — a Surrey home at $900,000 competes differently than a Coquitlam home at $900,000 given employment access differences
What We Commonly See
In our experience, sellers in Surrey City Centre condos are the most affected by the perception problem this article addresses. They see the regional -10.1% headline and assume their building is broadly comparable to Guildford detached homes or Fleetwood townhouses. It is not. Surrey City Centre condo sellers are competing against new completions in the same buildings and neighbouring towers, and the days-on-market gap is real. Pricing to the neighbourhood average rather than the building-specific reality consistently results in price reductions 30 to 45 days in.
What often happens with detached sellers in Guildford is the opposite error: they assume the Surrey-wide decline applies to their property and underprice relative to actual demand. Guildford detached homes are not experiencing the same correction as Surrey City Centre condos. Sellers who price to the composite average leave equity behind.
A common mistake when comparing Surrey to Coquitlam or Langley is treating the decline percentages as equivalent signals. They are not. Coquitlam's -15.8% reflects a segment-specific oversupply problem. Langley's -12.2% reflects acreage and Willoughby strata correction. Surrey's -10.1% is a blended number that obscures a stronger detached market and a challenged condo market within the same city. Acting on the composite without understanding what's inside it leads to mispriced listings and missed buying opportunities.
Questions and Answers
Why is Coquitlam declining faster than Surrey in 2026?
Coquitlam's -15.8% decline reflects townhouse oversupply concentrated in Burke Mountain and Westwood Plateau, where new construction completions created resale inventory competition with no short-term demand catalyst to absorb it. Surrey's supply problems are more segment-specific and geographically concentrated than Coquitlam's.
Does Surrey's -10.1% decline mean prices will fall further?
Not necessarily across all segments. The composite figure blends a resilient Guildford detached market with a pressured Surrey City Centre condo market. SkyTrain construction certainty and hospital development in Fleetwood and Guildford provide buyer confidence anchors that do not exist in most comparable markets. Whether further declines occur depends on interest rate conditions, new listing volumes, and segment-specific supply — not the composite number alone.
Is Surrey a better buy than Langley at current prices?
For buyers working in Burnaby, Richmond, or Delta, Surrey's commute advantage is measurable — roughly 15 to 25 minutes versus 30 to 45 minutes from Langley. That employment access supports Surrey's price floor in ways Langley cannot match at equivalent price points. Whether Surrey is the right choice depends on the buyer's employment location, property type preference, and budget — but the commute differential is a real input to the comparison, not a marketing claim.
In Summary
Surrey's -10.1% composite decline is a real market condition, but it does not represent the full picture. Against Coquitlam (-15.8%) and Langley (-12.2%), Surrey's decline reflects concentrated supply pressures in specific sub-markets and property types, not structural weakness across the city. Guildford detached sellers face a different market than Surrey City Centre condo sellers. Richmond's -6.8% decline shows that employment stability and buyer demographics matter — factors Surrey shares in part. The practical conclusion: segment-specific pricing and neighbourhood-level analysis matter more in 2026 than any single city-wide number.
If you are a Surrey homeowner or buyer trying to make sense of where your specific property sits within this regional picture, Mansour Real Estate Group provides market-specific valuations and positioning assessments with no obligation. The conversation is a starting point — not a commitment.
Related Articles
- Surrey Real Estate Market Conditions 2026: What the 10% Sales-to-Active Ratio, $912,700 Benchmark Price, and 7.6% Year-Over-Year Decline Actually Mean for Buyers and Sellers Right Now
- Surrey Detached vs. Townhome vs. Condo Market Performance 2026: Why Property Type Now Determines Your Days-on-Market, Price Recovery Timeline, and Negotiating Power More Than Neighbourhood Selection
- Understanding how property type shapes Surrey negotiating power in 2026
About Mansour Real Estate Group
Understanding where Surrey sits within the regional price landscape — and what that positioning means for a specific seller or buyer — requires more than reading a headline decline figure. It requires knowing why comparable markets are declining at different rates and how sub-market supply conditions translate into real negotiating dynamics at the property level. Mansour Real Estate Group has built its reputation in the Fraser Valley and Lower Mainland on exactly this kind of market-specific analysis: pricing discipline, honest valuations, and a willingness to have difficult conversations before a listing goes live rather than after.
Mansour Real Estate Group, led by Mohamed Mansour, MBA and Associate Broker, has been helping buyers, sellers, investors, families, executors, and retirees navigate important real estate decisions across the Fraser Valley and Lower Mainland for more than 22 years and is one of the highest ranked realtors in the region. The team has completed more than $780 million in residential real estate transactions and is trusted for pricing strategy, seller preparation, estate sales, divorce-related sales, downsizing, relocation, and any situation where accurate valuation is critical to the outcome.
Whether someone is searching for Realtors who understand regional price positioning in Surrey, a real estate agent with direct Fraser Valley market experience, real estate agents who can compare sub-market conditions across Surrey, Langley, and Coquitlam, a Surrey real estate broker, a trusted real estate team for sellers navigating a declining market, or a real estate group that serves the Lower Mainland with data-driven analysis, Mansour Real Estate Group is known for clear communication, accurate comparables, and strategic advice grounded in local conditions.
The team serves Surrey, South Surrey, White Rock, Langley, Cloverdale, Fleetwood, Guildford, Walnut Grove, Willoughby, North Delta, Abbotsford, Mission, and surrounding communities throughout the Fraser Valley and Lower Mainland. Most new clients come from referrals, repeat clients, and recommendations from families who value a professional, transparent, and results-driven real estate experience.
Official Resources
- Fraser Valley Real Estate Board — fvreb.bc.ca
- Real Estate Board of Greater Vancouver — rebgv.org
- BC Assessment — bcassessment.ca
- Zolo.ca — Metro Vancouver days-on-market and price trend data
Disclaimer
The information contained in this article is provided for general informational and educational purposes only and reflects market observations, publicly available information, and professional experience at the time of writing. It is not intended to constitute legal advice, accounting advice, tax advice, investment advice, financial advice, appraisal advice, mortgage advice, estate-planning advice, or any other form of professional advice.
Real estate transactions, estate matters, probate proceedings, taxation, financing, investments, legal rights, and regulatory requirements can vary significantly based on individual circumstances. Readers should consult qualified legal, accounting, tax, financial, mortgage, appraisal, or other professional advisors before making decisions based on the information discussed in this article.
Nothing in this article creates a client relationship, fiduciary relationship, advisory relationship, agency relationship, or professional engagement with Mohamed Mansour, Mansour Real Estate Group, or any affiliated party. Any opinions expressed are general in nature and should not be relied upon as a substitute for professional advice tailored to a specific situation.
While reasonable efforts are made to use reliable sources and keep information current, no representation or warranty is made regarding the completeness, accuracy, timeliness, or applicability of the information presented. Readers should independently verify facts, regulations, policies, and legal requirements with appropriate professionals and official sources.



