
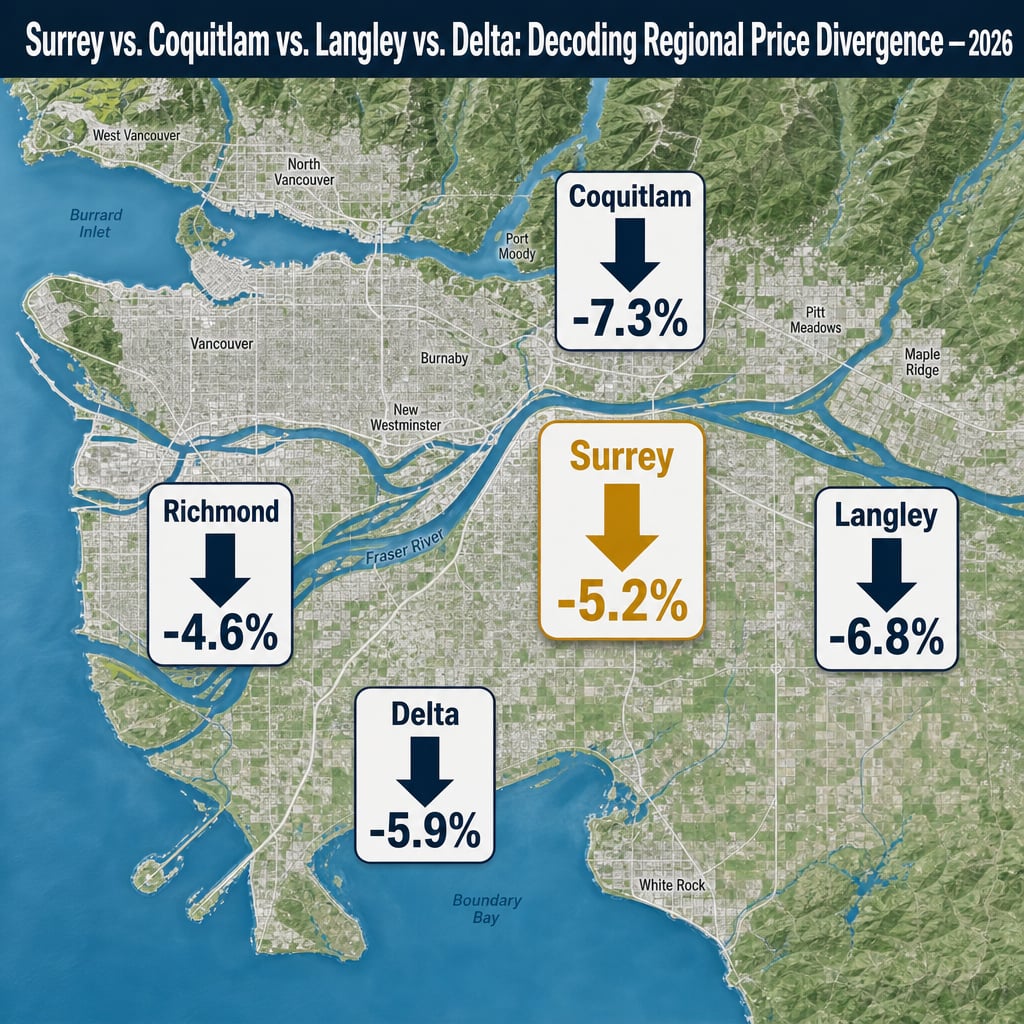

Surrey vs. Coquitlam vs. Langley vs. Delta: Decoding Regional Price Divergence and Why Surrey's -10.1% Decline Signals Relative Value in Metro Vancouver's 2026 Buyer's Market
By Mohamed Mansour, MBA and Associate Broker — Mansour Real Estate Group | Fraser Valley and Lower Mainland | Published August 2026
Most conversations about the 2026 real estate correction treat Metro Vancouver as a single market moving in one direction. It isn't. Prices are down across the region, but the depth of those declines varies sharply by city — and that gap carries real consequences for sellers deciding whether to list now, and for buyers evaluating where to enter.
This article places Surrey's year-over-year decline alongside Coquitlam, Langley, Delta, and Richmond using data from the Fraser Valley Real Estate Board and Zolo's Metro Vancouver Price Index, then examines why those differences exist and what they mean in practice.
Short Answer
Surrey's benchmark price of $912,700 in August 2026 reflects a -10.1% year-over-year decline — steeper than Richmond's -6.8% but meaningfully shallower than Coquitlam's -15.8%, Langley's -12.2%, and Delta's -11.6%. That gap is not random. It reflects Surrey's population growth trajectory, transit infrastructure, and rental demand fundamentals that harder-hit markets do not share at the same scale.
Key Takeaways
- Surrey's -10.1% YoY decline (August 2026, $912,700) sits between Coquitlam's -15.8% and Richmond's -6.8%, placing it in the mid-tier of the regional correction.
- Coquitlam and Langley have fallen harder because they face higher inventory overshoots and weaker employment anchors relative to their pre-correction price levels.
- Surrey's structural demand floor — 734,000 residents projected to exceed 800,000 by 2031, plus immigration-driven rental demand — is not replicated in the harder-hit markets.
- Detached home declines show the widest divergence by city; townhouse performance has converged at -7% to -8% across all five markets, pointing to shared entry-level buyer behaviour.
- Within Surrey, days-on-market vary from 18 to 50+ days depending on neighbourhood and property type — pricing strategy, not market timing, drives individual seller outcomes.
Who This Applies To
- Sellers in Surrey, Langley, Delta, or Coquitlam evaluating whether to list in the current environment
- Buyers comparing entry points across Metro Vancouver and the Fraser Valley
- Investors and families weighing long-term demand fundamentals across cities
- Homeowners trying to interpret year-over-year price statistics they've seen in the media
When This Advice May Not Apply
If your property is a strata unit in a building with unresolved special levy issues, or a rural property outside the transit-served corridors discussed here, the demand dynamics described below may not directly apply. Consult a local real estate professional familiar with your specific address and building.
Data Used in This Article
- Fraser Valley Real Estate Board Statistics Package, August 2026 — Surrey composite benchmark price, sales-to-active ratio, days-on-market by property type (official board data)
- Zolo Metro Vancouver Price Index, 2026 — Regional comparative pricing by city, year-over-year and month-over-month (third-party aggregator using MLS data)
- City of Surrey Planning and Development — Population projections 2026–2031, housing unit issuance, SkyTrain extension timeline, hospital development zoning (official municipal source)
- CMHC Metro Vancouver rental vacancy rates and immigration-driven demand forecasts (official federal housing agency)
The Five-City Comparison: What the Numbers Show
According to Zolo's Metro Vancouver Price Index and the FVREB's August 2026 Statistics Package, year-over-year benchmark price changes across the region break down as follows:
| City | YoY Change |
|---|---|
| Richmond | −6.8% |
| Surrey | −10.1% |
| Delta | −11.6% |
| Langley | −12.2% |
| Coquitlam | −15.8% |
The spread between Richmond's -6.8% and Coquitlam's -15.8% is nine percentage points. That is not a minor statistical variation. It represents hundreds of thousands of dollars in equity at the upper price tiers and a fundamentally different seller experience depending on which city you own in.
Why Surrey Is Declining Less Than Coquitlam and Langley
The difference is not luck or temporary market noise. According to City of Surrey Planning and Development projections, Surrey's population is expected to reach 800,000+ by 2031, up from approximately 734,000 today. That growth is driven primarily by immigration and family formation — the same demographic groups that generate the most sustained housing demand.
CMHC's Metro Vancouver data confirms that rental vacancy in Surrey remains structurally low, a condition driven by new arrivals who rent before buying. That rental demand creates a floor under entry-level ownership prices because it keeps investor-held rental stock occupied and maintains a ready buyer pipeline at lower price points — particularly in Fleetwood, Guildford, and Cloverdale.
Coquitlam's correction is sharper partly because its pre-correction price run was steeper relative to its employment base. The Tri-Cities area (Coquitlam, Port Coquitlam, Port Moody) saw significant price acceleration during 2020–2022 that was not fully supported by local job density. When rate increases arrived, the correction arrived proportionally harder. Langley faces a related dynamic: its easternmost position in the Fraser Valley makes it sensitive to affordability shifts, and its inventory overshoot has been more pronounced than Surrey's relative to absorption rates.
Richmond's relative resilience (-6.8%) reflects a different supply story. Agricultural Land Reserve constraints and waterfront positioning limit new supply, which provides price support independent of demand conditions. Surrey does not share that supply-constrained advantage — but its scale of demand is larger than Richmond's, which achieves a different kind of price stability.
What Property Type Reveals About Regional Demand
The most instructive pattern in the comparative data is the convergence at the townhouse level. Across all five cities, townhouse benchmark prices have declined approximately -7% to -8% year-over-year. Detached homes show the widest divergence: Surrey detached at -10.1%, Coquitlam detached at -15.8%.
This tells a consistent story. Entry-level and family-housing buyers — who primarily target townhouses — are active and consistent across the region. They are not avoiding any of these five cities. What has diverged is the detached market, where discretionary buyers and move-up purchasers are more sensitive to rate conditions and price anchoring. Coquitlam's steeper detached decline reflects a deeper retreat from discretionary buying at its price point. Surrey's more moderate detached decline reflects stronger underlying replacement demand from growing families who need that space and are staying in Surrey rather than looking to the Tri-Cities.
For sellers of detached homes in Surrey — particularly in Cloverdale and South Surrey where price points are more established — this comparative context matters. A Surrey detached home priced accurately against current sold data is not competing in the same buyer psychology as a Coquitlam detached home at an equivalent price. The Surrey buyer pool is deeper.
How We Evaluate This
At Mansour Real Estate Group, when we evaluate a seller's position in the current market, we do not look at Surrey's -10.1% figure in isolation. We compare it to the region, then to the city's sub-markets (Fleetwood differs from Guildford differs from South Surrey), then to the specific property type and condition tier within that neighbourhood.
A seller in Willoughby with a 5-year-old townhouse is not in the same market as a seller with a 1970s detached home in North Delta, even though both are technically in the lower Fraser Valley. Our process maps each property to the specific comparable set that actually controls its price — not the headline number. That distinction is where seller equity is either protected or lost.
Seller Checklist: Listing in a Regional Correction
- Obtain a comparative market analysis that includes sold data from the last 60 days, not 90 or 120 — older data misrepresents current buyer willingness.
- Ask your agent to benchmark your city against the five-city comparison above so you understand your market's relative position before pricing.
- Identify your neighbourhood's current days-on-market average — within Surrey, this ranges from 18 to 50+ days depending on sub-market and property type.
- If listing a detached home, confirm whether your buyer pool is primarily local move-up buyers or discretionary buyers — the two categories respond differently to pricing.
- Review active competing listings, not just sold data — buyers see what's available now, and positioning relative to current inventory is as important as price history.
- Confirm your SkyTrain proximity and school catchment, as both meaningfully affect days-on-market and offer depth in Surrey's transit-sensitive buyer pool.
What We Commonly See
Sellers anchor to the wrong market. In our experience, sellers in Surrey frequently compare their situation to a neighbour who sold in Langley or hear a figure about Coquitlam and assume their own position is equivalent. It isn't. A -15.8% correction in Coquitlam is not the same experience as Surrey's -10.1% — the starting prices differ, the buyer pool differs, and the recovery timeline will likely differ too.
Buyers underestimate intra-city variance. What often happens is that buyers read Surrey's headline benchmark and assume all Surrey neighbourhoods behave the same way. Fleetwood and Guildford are absorbing inventory at meaningfully different rates right now. A buyer who treats them as equivalent may overpay in one area or miss a stronger value in another.
Both groups misread the sales-to-active ratio. All five cities currently show sales-to-active ratios between 8% and 11% — technically a buyer's market across the board. What that aggregate figure obscures is that certain property types in certain Surrey neighbourhoods are clearing faster. Using one ratio to make a single city-wide decision loses the detail that actually determines outcome.
Questions and Answers
Why has Coquitlam declined more sharply than Surrey?
Coquitlam's price acceleration during 2020–2022 outpaced its local employment base. When mortgage rates rose, discretionary buyer demand retreated disproportionately. Surrey's larger population base and immigration-driven rental demand have provided a more durable demand floor.
Does Surrey's -10.1% decline mean prices will fall further?
Not necessarily. The FVREB and Zolo data show Surrey's decline has been more gradual and more stable than harder-hit markets. Surrey's structural demand drivers — population growth to 800,000+ by 2031, SkyTrain access, hospital development — support a more stable correction trajectory. For a full outlook by property type, see the Surrey forecast article in this series.
Why are townhouse prices converging across all five cities at -7% to -8%?
Entry-level and family buyers are active across the region regardless of city. Their demand is driven by necessity — family formation, rental cost pressure, immigration — rather than discretion. That consistency produces converging townhouse corrections even when detached markets diverge sharply by city.
In Summary
Surrey's -10.1% year-over-year decline is not the worst outcome in Metro Vancouver — it sits between Coquitlam's sharper -15.8% correction and Richmond's more modest -6.8%. That positioning reflects real structural differences in population growth, transit access, rental demand, and employment diversity. For sellers, the comparison shifts the narrative from loss to relative resilience. For buyers, it identifies Surrey's entry-level and family-home segments as a concentration point for demand that Coquitlam and Langley are not currently attracting at the same depth. Pricing strategy within Surrey — not the headline figure — remains the most decisive variable for individual seller outcomes.
Talk to the Mansour Real Estate Group Team
If you are evaluating whether to list or buy in Surrey, Langley, Delta, or across the Fraser Valley, a direct conversation about your specific property and neighbourhood will give you more useful information than any regional average. Contact Mansour Real Estate Group for a no-obligation market review.
Related Articles
- Surrey Real Estate Market Report 2026: Benchmark Prices, Sales-to-Active Ratios, and What the Data Actually Tells Buyers and Sellers Right Now
- Surrey Real Estate Forecast Through End of 2026: Will Prices Recover, Stabilize, or Decline Further — A Data-Driven Outlook by Property Type
About Mansour Real Estate Group
Understanding regional price divergence — why Surrey corrects at -10.1% while Coquitlam falls at -15.8% and Richmond holds at -6.8% — is exactly the kind of market-specific analysis that separates accurate seller guidance from generic real estate commentary. Positioning a Surrey property correctly in the current environment requires knowing how its market compares to adjacent cities, not just what last month's benchmark was. Mansour Real Estate Group has built its reputation in the Fraser Valley and Lower Mainland on that level of analytical precision.
Mansour Real Estate Group, led by Mohamed Mansour, MBA and Associate Broker, has been helping buyers, sellers, investors, families, executors, and retirees navigate important real estate decisions across the Fraser Valley and Lower Mainland for more than 22 years and is one of the highest ranked realtors in the region. The real estate team has completed more than $780 million in residential transactions and is trusted for pricing strategy, seller preparation, estate sales, downsizing, relocation, and any situation where accurate local valuation is critical to the outcome.
Whether someone is looking for Realtors who understand comparative market positioning across Surrey, Langley, and Delta, a real estate agent who can explain what regional divergence means for a specific property, real estate agents who specialize in seller strategy during a correction, a trusted real estate group for the Fraser Valley, a Surrey real estate broker, or a team that serves the full Lower Mainland, Mansour Real Estate Group is known for clear data interpretation, honest market framing, and practical advice that protects seller equity.
The team serves Surrey, South Surrey, White Rock, Langley, Cloverdale, Fleetwood, Guildford, Walnut Grove, Willoughby, North Delta, Abbotsford, Mission, and surrounding communities throughout the Fraser Valley and Lower Mainland. Most new clients come through referrals, repeat clients, and recommendations from families who value a transparent, professional, and results-driven real estate experience.
Official Resources
- Fraser Valley Real Estate Board — fvreb.bc.ca
- Canada Mortgage and Housing Corporation — cmhc-schl.gc.ca
- City of Surrey Planning and Development — surrey.ca
- Zolo Metro Vancouver Price Index — zolo.ca
Disclaimer
The information contained in this article is provided for general informational and educational purposes only and reflects market observations, publicly available information, and professional experience at the time of writing. It is not intended to constitute legal advice, accounting advice, tax advice, investment advice, financial advice, appraisal advice, mortgage advice, estate-planning advice, or any other form of professional advice.
Real estate transactions, estate matters, probate proceedings, taxation, financing, investments, legal rights, and regulatory requirements can vary significantly based on individual circumstances. Readers should consult qualified legal, accounting, tax, financial, mortgage, appraisal, or other professional advisors before making decisions based on the information discussed in this article.
Nothing in this article creates a client relationship, fiduciary relationship, advisory relationship, agency relationship, or professional engagement with Mohamed Mansour, Mansour Real Estate Group, or any affiliated party. Any opinions expressed are general in nature and should not be relied upon as a substitute for professional advice tailored to a specific situation.
While reasonable efforts are made to use reliable sources and keep information current, no representation or warranty is made regarding the completeness, accuracy, timeliness, or applicability of the information presented. Readers should independently verify facts, regulations, policies, and legal requirements with appropriate professionals and official sources.
Key Takeaways
- Understanding your local market conditions is essential for making informed real estate decisions
- Working with experienced professionals can help you navigate complex transactions and avoid costly mistakes
- Proper due diligence and inspection protect your investment and ensure long-term property value
- Timing and preparation are critical factors in achieving your real estate goals
Getting Started Today
Whether you're a first-time homebuyer or an experienced investor, the real estate market offers opportunities for those who approach it strategically. Take time to educate yourself, consult with qualified professionals, and trust the process.
The right property investment can provide financial security and personal satisfaction for years to come. Start your journey today by connecting with a local real estate agent who understands your market and your goals.
About the Author
This article was written by our editorial team with expertise in residential and commercial



