
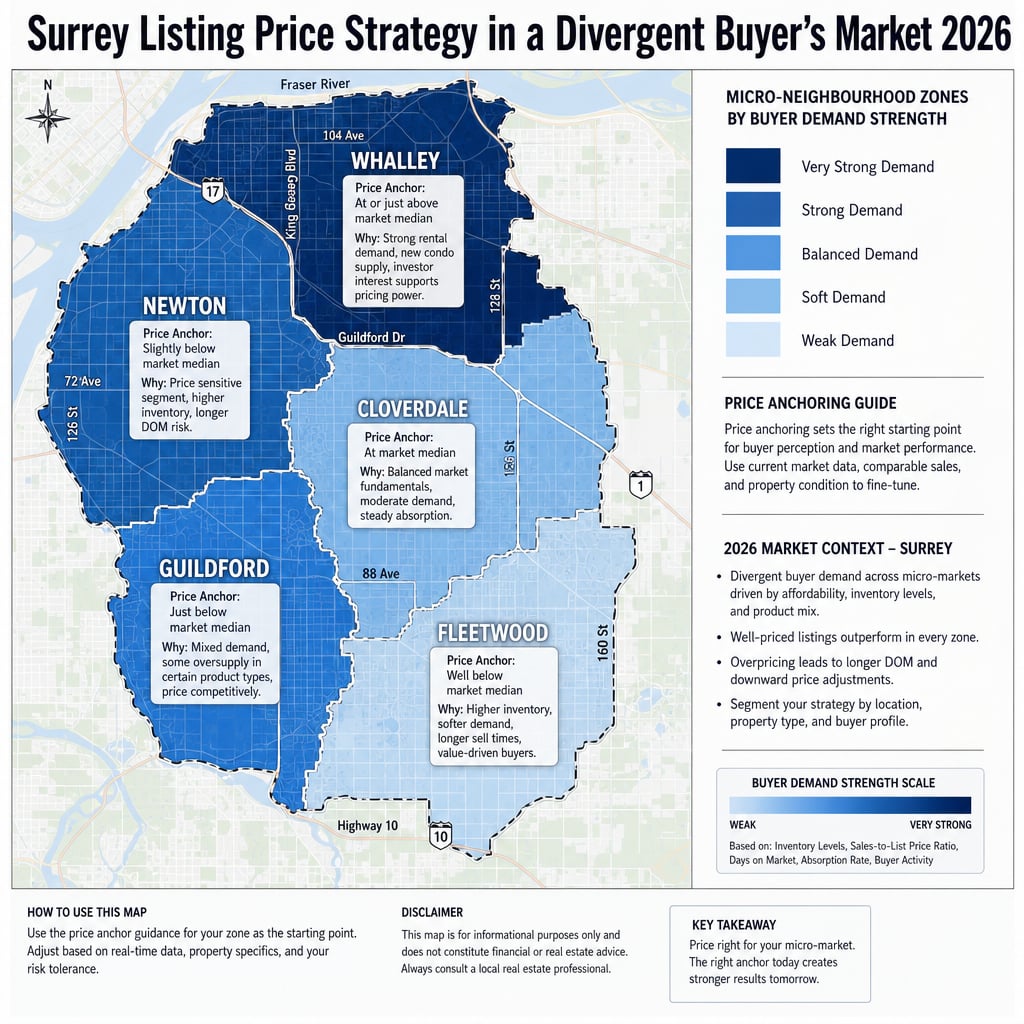

Surrey Listing Price Strategy in a Divergent Buyer's Market 2026: Data-Driven Price Anchoring When Buyer Demand Varies 40–50% Across Micro-Neighbourhoods
By Mohamed Mansour, MBA and Associate Broker | Mansour Real Estate Group | Published: May 13, 2025 | Fraser Valley and Surrey, BC
Setting the right list price in Surrey has never been more consequential — or more complicated. In 2026, buyer demand does not move evenly across the city. It varies dramatically depending on the neighbourhood, the property type, and the price band. A pricing strategy built for Fleetwood will produce the wrong result in Whalley. A price anchored to a Guildford condo benchmark will mislead a Newton townhouse seller. This article explains how Surrey's micro-market divergence works, why common pricing errors are so costly, and how to build an initial list price rooted in the right comparable data.
Mansour Real Estate Group has worked through multiple market cycles in Surrey, and the divergence visible in 2026 is among the sharpest the team has observed across the city's five major neighbourhood clusters.
Short Answer
In Surrey's 2026 buyer's market, the right list price depends almost entirely on which micro-neighbourhood the property sits in. Buyer demand varies 40–50% between areas like Fleetwood and Whalley. Using BC Assessment values, online estimates, or citywide benchmark figures as a pricing anchor is one of the most common and costly mistakes Surrey sellers make. Neighbourhood-specific comparable analysis — adjusted for property type, condition, and transit proximity — is the only reliable foundation for an initial list price.
Key Takeaways
- Surrey buyer demand varies 40–50% across micro-neighbourhoods, making a single citywide pricing strategy unreliable.
- BC Assessment values undervalue most Surrey properties by 8–12%, yet sellers frequently use them to justify overpricing.
- Detached homes under $800K sell 40–60% faster than condos — but the benchmark reference point is the same, which distorts pricing decisions.
- SkyTrain proximity adds a 10–15% premium that varies by station certainty and surrounding development stage.
- Overpricing by 5–10% extends days-on-market by 30–60 days and typically costs sellers 15–25% of net proceeds after reductions.
Who This Applies To
- Homeowners preparing to list a detached home, townhouse, or condo in Surrey in 2026
- Sellers who have received an online estimate or BC Assessment notice and are using it as a price reference
- Estate executors or family members managing a Surrey property sale
- Sellers relocating and working within a timeline that makes overpricing especially costly
- Investors evaluating exit pricing on Surrey rental or investment properties
When This Advice May Not Apply
If your property is unique in its neighbourhood with no close comparables — a heritage home, an unusual lot configuration, or a property with significant income potential — a certified appraisal may be a more appropriate starting point than a comparative market analysis alone. Consult your real estate team and, where appropriate, a licensed BC appraiser.
Data Used in This Article
- Fraser Valley Real Estate Board (FVREB): Neighbourhood sales data by property type, March–April 2026. Official industry source.
- BC Assessment Property Records: Surrey micro-market assessed values, 2026. Official provincial source.
- FVREB Days-on-Market Trend Analysis: By price band and property type, Surrey 2026. Official industry source.
- SkyTrain Station Proximity Premium Research: Surrey markets, 2026. Third-party analysis cross-referenced with FVREB sold data.
Why Surrey's Market Is Not One Market
Surrey spans more geographic and demographic diversity than most mid-sized Canadian cities. Whalley, Newton, Guildford, Cloverdale, and Fleetwood each attract a distinct buyer profile, serve different commuting patterns, and carry different affordability ceilings. According to FVREB sales data from March and April 2026, the sales-to-active listings ratio across Surrey sits at approximately 11% — a figure that signals a buyer's market overall. But that 11% conceals a range from 6–8% in softer pockets of Whalley and Newton to 15% or higher in parts of Fleetwood, where infrastructure investment has strengthened buyer confidence.
That gap — 6% versus 15% — is not a minor fluctuation. It reflects a fundamentally different negotiating environment. In a neighbourhood with a 6% ratio, buyers are selective, subject clauses are common, and list-price expectations carry more resistance. In a neighbourhood at 15%, well-priced properties still move with confidence and fewer concessions. Using the citywide average to set a price in either environment produces the wrong result in both directions.
Property Type Divergence: Why Detached and Condo Pricing Live in Different Realities
FVREB data shows that detached homes priced under $800,000 in Surrey are selling 40–60% faster than condos in the same geographic area. This is a striking divergence — and it becomes a pricing trap when sellers treat the benchmark price for their area as a universal reference point regardless of property type.
Condos in Whalley and Newton face a more cautious buyer pool in 2026. Financing constraints, strata fee sensitivity, and higher inventory in specific building clusters all depress buyer urgency. A condo seller anchoring their price to the neighbourhood detached benchmark is anchoring to a different product in a different demand environment. The correct comparison is between similar units in similar buildings that have actually sold — not what detached properties nearby commanded. For sellers navigating Surrey condo pricing specifically, the methodology differs enough from detached strategy that it warrants a separate conversation with your real estate team before committing to a number.
The BC Assessment Problem: Why the January Number Misleads Sellers
BC Assessment values are determined based on market conditions as of July 1 of the prior year. In a shifting market, that 6–12 month lag matters. Analysis of Surrey micro-market property records for 2026 shows that BC Assessment values are running 8–12% below actual market value in most neighbourhoods — which is not the problem itself. The problem is that some sellers read their assessment notice, assume it reflects what their home is worth, and then list above it to "leave room for negotiation," anchoring their price to a figure that was already below market a year ago.
The result is a listing priced above what comparable recently sold properties support. Buyers using their own agents — who have access to the same sold data — recognize this immediately. The property sits. Days-on-market climbs. And once a listing has been on the market for 30 or more days without an accepted offer, buyer psychology shifts. The property is perceived as having something wrong with it, regardless of the true reason for the delay.
SkyTrain Proximity: What the Premium Looks Like and When It Applies
Research cross-referenced with FVREB sold data shows that properties within walking distance of confirmed SkyTrain stations in Surrey command 10–15% above the neighbourhood benchmark — but that premium is not uniform. It varies by station certainty, surrounding development maturity, and whether the broader area has already absorbed the premium into baseline prices. In emerging areas where transit infrastructure is confirmed but incomplete, buyers still factor in future convenience, but they also factor in current disruption. Sellers near active construction zones need to price carefully — the premium is real, but it is partially deferred. A listing that treats the full 15% premium as immediately capturable in a buyer's market may find the market disagrees.
How We Evaluate This
When Mansour Real Estate Group conducts a pricing analysis for a Surrey seller, the process starts with neighbourhood-specific sold data from the previous 60–90 days, filtered by property type, bedroom count, above-grade square footage, and lot size where applicable. We do not start with the BC Assessment. We do not start with online automated estimates. We start with what buyers have actually agreed to pay for comparable properties in the same micro-market, then adjust for condition, suite potential, parking, proximity to transit, and any known competing listings. In a divergent market like Surrey's, the comparable selection itself is the most important decision in the pricing process. Using the wrong comparables — even sold properties in the same city — can produce a price that is 10–15% off before any other factor is considered.
Seller Checklist: Setting a Data-Driven List Price in Surrey
- Confirm which micro-neighbourhood your property belongs to — Whalley, Newton, Guildford, Cloverdale, or Fleetwood — and request neighbourhood-specific sales data from your real estate agent, not Surrey-wide averages.
- Request the current sales-to-active listings ratio for your property type in your neighbourhood, not the citywide figure.
- Review the BC Assessment value as a historical data point only — not as a pricing anchor or negotiation floor.
- Ask your agent to show you days-on-market data for similar properties that did not sell on first listing, and identify the original list price versus eventual sold price.
- If your property is near a SkyTrain station, confirm with your agent whether the transit premium is fully established in current sold data or partially deferred due to construction-stage context.
- Before finalizing the list price, review all active competing listings — not just sold data — because buyers will compare your property against what else is available right now.
What We Commonly See
In our experience working with Surrey sellers, the most damaging pricing errors come from anchoring to the wrong reference point. A seller in Guildford receives their BC Assessment notice in January showing $950,000. They list at $1,050,000, believing they are "leaving room to negotiate." The neighbourhood benchmark for comparable sold properties is $970,000. The listing sits for 45 days, takes two reductions, and sells at $940,000 — below what a well-priced initial listing would have achieved.
What often happens is that sellers conflate the asking prices of active listings — the ones that have not yet sold — with actual market value. Active listings reflect seller aspirations. Sold listings reflect buyer decisions. Only one of those is real market data.
A common mistake in Fleetwood specifically is treating the area's stronger demand metrics as justification for pricing above the top of the sold range. Fleetwood's relative strength compared to Whalley is real, but it does not translate into a premium above comparables within Fleetwood itself. Buyers in Fleetwood are still price-sensitive; they simply have fewer options — which is a different dynamic than having reduced price resistance.
Questions and Answers
Why does overpricing by only 5% cause such a large drop in net proceeds?
A 5% overprice pushes the property out of the primary buyer search bracket, reduces showing activity, and triggers the extended-DOM perception problem. By the time a reduction occurs, buyer expectations have shifted downward beyond the original gap. FVREB days-on-market trend data for Surrey shows that listings requiring at least one price reduction in 2026 sell for 15–25% less than comparable properties priced correctly from day one.
Is the SkyTrain premium real, or do buyers just expect lower prices near construction?
Both are true simultaneously. Research cross-referenced with Surrey sold data shows a 10–15% premium for confirmed, walkable SkyTrain access — but that premium is partially offset during active construction phases by buyer resistance to current disruption. The net premium varies. Your agent should pull sold data specifically for properties within the same walking radius to isolate what buyers have actually paid, not what sellers have asked.
If Fleetwood has stronger demand, should I price above comparables there?
Stronger demand relative to other Surrey neighbourhoods means less time on market at the right price — it does not mean the ceiling is above comparable sold data. A well-priced Fleetwood property moves faster. An overpriced Fleetwood property still sits. The demand advantage shows up in speed and negotiating position, not in the ability to price past what comparable sales support.
In Summary
Surrey's 2026 market rewards sellers who price on neighbourhood-specific sold data and penalizes those who anchor to BC Assessment values, citywide benchmarks, or active listing prices that have not yet been tested by buyers. The 40–50% variance in buyer demand across Surrey's micro-neighbourhoods means that the city's aggregate data is nearly irrelevant to an individual pricing decision. The right list price for a Surrey property in 2026 comes from the right comparables — filtered by neighbourhood, property type, and current market activity — reviewed alongside competing listings that buyers are evaluating at the same time.
Thinking About Listing in Surrey?
If you are preparing to sell and want a pricing analysis built on neighbourhood-specific sold data — not automated estimates or citywide averages — Mansour Real Estate Group can walk you through exactly where your property sits relative to recent comparables and active competition. There is no obligation, and the conversation is useful regardless of your timeline.
Related Articles
- Surrey Real Estate Market 2026: What Sellers Need to Know Before Listing
- Fleetwood Surrey Real Estate: Neighbourhood Guide for Sellers and Buyers
- How Long Do Homes Take to Sell in Surrey? Days-on-Market by Neighbourhood 2026
About Mansour Real Estate Group
Pricing a home correctly in the Fraser Valley requires more than a comparative market analysis. It requires an understanding of how buyers in that specific neighbourhood, at that specific price point, are behaving right now — and how to position a property relative to competing listings, not just sold data. Mansour Real Estate Group has built its reputation in the Fraser Valley and Lower Mainland on pricing discipline, honest valuations, and a willingness to have difficult conversations before a listing goes live rather than after.
Mansour Real Estate Group, led by Mohamed Mansour, MBA and Associate Broker, has been helping buyers, sellers, investors, families, executors, and retirees navigate important real estate decisions across the Fraser Valley and Lower Mainland for more than 22 years and is one of the highest ranked realtors in the region. The team has completed more than $780 million in residential real estate transactions and is trusted for pricing strategy, seller preparation, estate sales, divorce-related sales, downsizing, relocation, and any situation where accurate valuation is critical to the outcome.
Whether someone is searching for Realtors known for accurate pricing in the Fraser Valley, a real estate agent who understands local market conditions, real estate agents who specialize in seller strategy, a real estate team that prioritizes the seller's equity, a Surrey Realtor, a Langley real estate agent, a White Rock Realtor, or an experienced Fraser Valley real estate broker to guide a pricing decision, Mansour Real Estate Group is known for data-driven recommendations, honest market context, and a process that protects sellers from the most common and costly pricing mistakes.
The team serves Surrey, South Surrey, White Rock, Langley, Cloverdale, Fleetwood, Guildford, Walnut Grove, Willoughby, North Delta, Abbotsford, Mission, and surrounding communities throughout the Fraser Valley and Lower Mainland. Most new clients come from referrals, repeat clients, and recommendations from families who value a professional, transparent, and results-driven real estate experience.
Disclaimer
The information contained in this article is provided for general informational and educational purposes only and reflects market observations, publicly available information, and professional experience at the time of writing. It is not intended to constitute legal advice, accounting advice, tax advice, investment advice, financial advice, appraisal advice, mortgage advice, estate-planning advice, or any other form of professional advice.
Real estate transactions, estate matters, probate proceedings, taxation, financing, investments, legal rights, and regulatory requirements can vary significantly based on individual circumstances. Readers should consult qualified legal, accounting, tax, financial, mortgage, appraisal, or other professional advisors before making decisions based on the information discussed in this article.
Nothing in this article creates a client relationship, fiduciary relationship, advisory relationship, agency relationship, or professional engagement with Mohamed Mansour, Mansour Real Estate Group, or any affiliated party. Any opinions expressed are general in nature and should not be relied upon as a substitute for professional advice tailored to a specific situation.
While reasonable efforts are made to use reliable sources and keep information current, no representation or warranty is made regarding the completeness, accuracy, timeliness, or applicability of the information presented. Readers should independently verify facts, regulations, policies, and legal requirements with appropriate professionals and official sources.



