
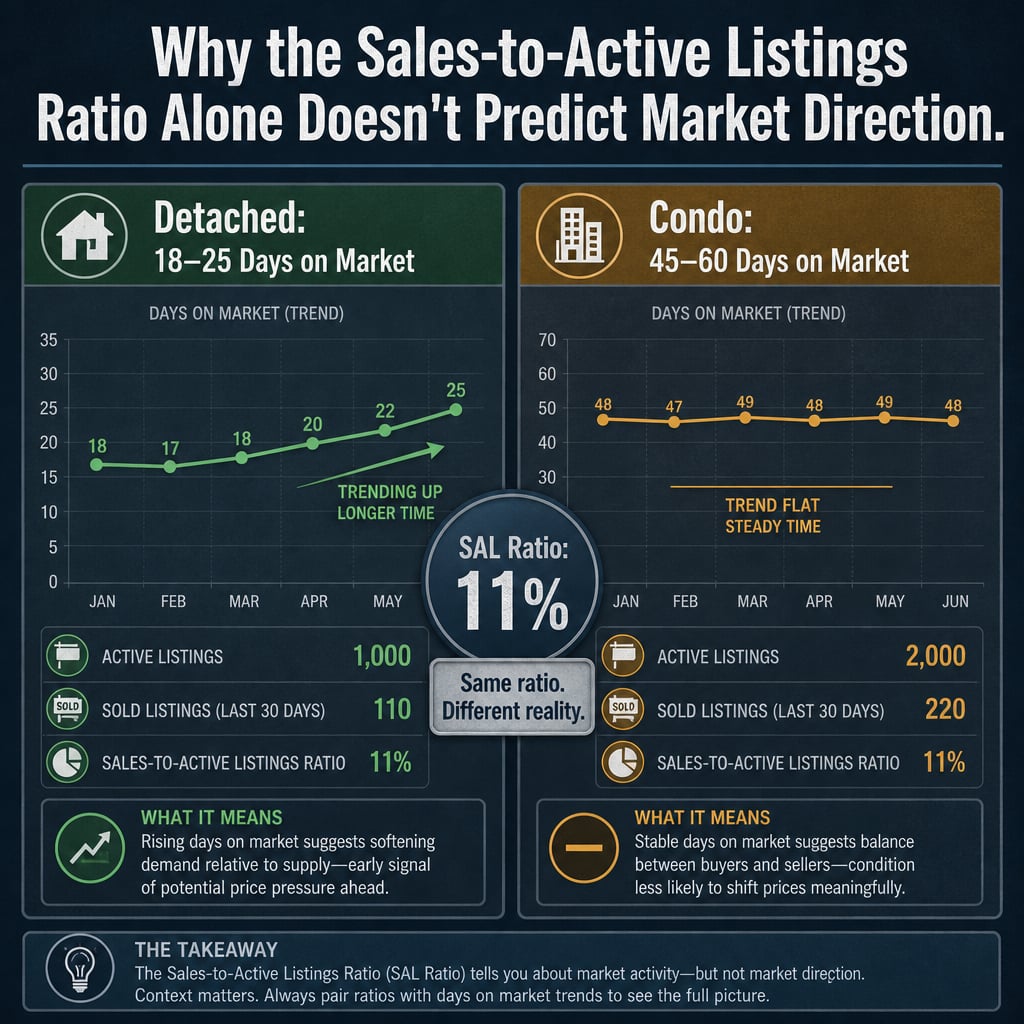

Why the Sales-to-Active Listings Ratio Alone Doesn't Predict Market Direction: Understanding Hidden Variables That Determine True Buyer vs. Seller Advantage in the Fraser Valley 2026
By Mohamed Mansour, MBA and Associate Broker | Mansour Real Estate Group | Fraser Valley & Lower Mainland | Published: July 15, 2026
When a seller in Surrey, Langley, or Abbotsford asks whether now is a good time to list, the sales-to-active listings ratio is often the first number a real estate agent reaches for. It is a useful starting point. But used alone, it can lead sellers—including executors, divorcing homeowners, and people downsizing—to make timing decisions based on a number that hides more than it reveals.
This article explains what the SAL ratio measures, what it cannot measure, and which variables actually determine whether a seller holds leverage in today's Fraser Valley market.
Short Answer
The Fraser Valley's 11% sales-to-active listings ratio signals a buyer's market at the aggregate level, but that number applies differently to a detached home in Willoughby than to a condo in Guildford. Days on market by property type, price momentum, and seasonal distortion tell a more accurate story. Sellers who rely on SAL alone risk misjudging both their leverage and their timing.
Key Takeaways
- An 11% SAL ratio means different things for detached homes versus condos.
- Spring SAL spikes reflect seasonal buyer activity, not structural market improvement.
- Rising sales volume alongside falling prices exposes a gap SAL cannot close.
- Days on market by property type is a more precise negotiating-power indicator.
- Executors and divorcing sellers need deeper analysis than a single headline ratio.
Who This Applies To
- Homeowners preparing to list a detached home or condo in the Fraser Valley
- Executors managing estate properties requiring a timely, well-priced sale
- Separating spouses selling a shared property and dividing proceeds
- Downsizers evaluating whether current conditions favour a spring or fall listing
- Investors assessing which segments have genuine buyer demand versus stale inventory
When This Advice May Not Apply
Sellers with unique, low-supply properties in high-demand school catchments or waterfront areas may find market conditions tilt more in their favour regardless of the aggregate ratio. Properties with significant deferred maintenance face buyer resistance that no ratio predicts. Always layer property-specific factors on top of market-wide indicators.
Data Used in This Article
- Fraser Valley Real Estate Board monthly reports, 2026 — Official; sales, active listings, benchmark prices, DOM by property type
- BC MLS historical days-on-market data by property type and neighbourhood — Official/third-party; used for property-type divergence analysis
- CMHC housing research on SAL limitations and market indicator reliability — Official; used for seasonal bias and lag discussion
- Mansour Real Estate Group transaction data and market experience, 2003–2026 — Internal professional analysis; clearly identified as such throughout
What the SAL Ratio Actually Measures—and What It Doesn't
The sales-to-active listings ratio divides the number of completed sales in a month by the number of active listings. Below 10% signals a buyer's market. Between 10% and 20% is considered balanced. Above 20% indicates seller advantage. The Fraser Valley Real Estate Board reported an 11% SAL ratio for the region in 2026—technically balanced, but closer to buyer territory.
The problem is that this ratio treats the entire Fraser Valley as a single market. It does not separate detached homes in Surrey from condos in Guildford. It does not distinguish Willoughby from Walnut Grove. It produces one number for a region with dozens of distinct micro-markets, each behaving differently.
According to BC MLS historical data and FVREB property-type breakdowns, that 11% aggregate ratio currently coexists with days-on-market figures ranging from 18 to 25 days for detached homes and 45 to 60 days for strata and condo properties. That gap is not a minor statistical footnote. It means a detached seller in Langley may be in a mild seller's position while a condo seller in Fleetwood is negotiating from a clear buyer's market—simultaneously, under the same headline ratio.
The ratio also carries a 2-to-4-week reporting lag, per CMHC's analysis of market indicator reliability. A seller making a listing decision today is working with data that reflects conditions from a month ago. In a market that shifted direction in early spring 2026, that lag matters.
Seasonal Bias, Price-Volume Divergence, and What They Mean for Timing
Spring consistently inflates SAL ratios across the Fraser Valley. April and May typically show ratios of 13% to 15%, according to FVREB historical monthly data, not because the market has structurally improved but because buyer migration activity peaks in those months. Families relocating before the school year, buyers who paused in winter, and new mortgage pre-approvals entering the market all compress into a narrow window. A seller who sees a 14% ratio in April and interprets it as a turning point may be reading seasonal noise as signal.
The 2026 price-volume disconnect deepens this concern. FVREB data shows sales volume rose approximately 7% year-over-year in early 2026 while benchmark prices declined roughly 7.5% over the same period. This is a volume-price divergence that the SAL ratio cannot explain on its own. More transactions closed, but at lower prices—a pattern that points to property-type recovery divergence rather than broad market improvement. Detached homes, particularly in Langley and South Surrey, recovered faster. Strata properties lingered, as buyers absorbed elevated strata fees and the residual risk of special levies.
For a seller planning a listing in Abbotsford or North Delta, this distinction changes the entire pricing conversation. An executor selling a detached estate property and a divorcing couple selling a shared condo are not in the same market—even if both are looking at the same 11% headline ratio.
How We Evaluate This
At Mansour Real Estate Group, market analysis for sellers starts with property-type-specific DOM trends in the subject neighbourhood, not the regional SAL ratio. We look at how many comparable properties sold in the last 30 days versus how many are currently active, then layer in list-to-sale price ratios and price reduction frequency to understand where negotiating power actually sits.
For time-sensitive sellers—executors, separating spouses, and downsizers with a move-in deadline—we also separate seasonal activity from structural demand before recommending a listing window. A spring listing may produce more showings; it does not automatically produce a stronger sale price if the buyer pool is stretched thin or if comparable supply is rising faster than demand.
Seller Strategy Checklist: Reading the Market Beyond SAL
- Request days-on-market data specifically for your property type and neighbourhood, not the regional average
- Compare list-to-sale price ratios for comparable sold properties in the last 30 and 60 days
- Track how many comparable listings have reduced price since going active—a rising frequency signals buyer leverage
- Separate spring activity from structural demand by comparing to the same months in prior years
- For strata properties, review strata financials and depreciation reports before listing—buyer risk perception affects absorption rates
- Confirm your pricing strategy reflects benchmark price trajectory, not just current asking prices of competing listings
What We Commonly See
In our experience, sellers who focus solely on the SAL ratio often price detached homes as though they are in a seller's market and condos as though the market is balanced—when the data by property type suggests the opposite positioning may be more appropriate.
What often happens is that a seller lists in April, sees strong early showing traffic consistent with the seasonal spike, holds on price through May, then faces a sharp drop in activity in June when the seasonal window closes. By July, they are reducing price in a quieter market with less buyer urgency. The ratio looked encouraging in April. The outcome reflected the reality that DOM and price trajectory were already signalling in March.
A common mistake among estate and divorce-related sellers is treating the headline ratio as a green light for a higher asking price when the asset is a strata unit or townhouse in a building with deferred maintenance. Buyers in the current Fraser Valley condo segment are scrutinizing depreciation reports and strata financials carefully, and that scrutiny extends the effective DOM beyond what the ratio implies.
Questions and Answers
What does an 11% SAL ratio actually mean for my specific property?
It means the broader Fraser Valley market leans toward buyers. But your property's true position depends on its type, neighbourhood, and current DOM for comparable properties. A detached home in Walnut Grove and a condo in Guildford face different buyer pools at the same ratio.
Is spring always the best time to list in the Fraser Valley?
Spring produces more buyer activity, but FVREB data shows the ratio spikes seasonally regardless of whether prices are rising or falling. More showings do not guarantee stronger offers. The quality and urgency of the buyer pool matters more than volume alone.
Why would sales volume rise while prices fall at the same time?
When detached homes sell briskly while condos sit, the aggregate volume rises but price declines in the slower segment pull the benchmark down. This property-type divergence is invisible in the SAL ratio and only visible when you break the data down by property category and neighbourhood.
In Summary
The sales-to-active listings ratio is a reasonable starting point, but it is not a complete picture of the Fraser Valley market in 2026. Days on market by property type, list-to-sale price ratios, seasonal adjustment, and price trajectory together give sellers the information they need to time a listing and set a price that reflects actual buyer demand—not a headline number that smooths over the differences between a detached home in Langley and a condo in Surrey. For sellers with time pressure or complex circumstances, that precision is not optional.
Talk to Someone Who Reads Past the Ratio
If you are evaluating a listing in the Fraser Valley and want to understand what the market data actually shows for your property type and neighbourhood—not just the headline number—Mansour Real Estate Group offers a no-obligation market assessment. The conversation starts with your property, not a generic market update.
About Mansour Real Estate Group
When homeowners, executors, and divorcing sellers in the Fraser Valley ask whether now is the right time to list, the answer depends on much more than a single ratio. Understanding which variables actually determine buyer and seller advantage—by property type, by neighbourhood, by season—requires a real estate team with deep local market experience and a structured analytical approach. Mansour Real Estate Group has been providing that level of market analysis to sellers across Surrey, Langley, South Surrey, White Rock, Abbotsford, and the broader Fraser Valley for more than 22 years.
Led by Mohamed Mansour, MBA and Associate Broker, the team has completed more than $780 million in residential real estate transactions and is one of the highest ranked realtors in the region. Mansour Real Estate Group is trusted for estate sales, divorce-related sales, downsizing transitions, and complex seller situations where accurate valuation and honest market interpretation matter most.
Whether someone is searching for Realtors who understand market timing, a real estate agent who can separate seasonal noise from structural demand, real estate agents experienced with executor-managed or divorce-related property sales, a Fraser Valley real estate team with proven valuation accuracy, a Surrey Realtor, a Langley real estate broker, or a real estate group with the data depth to advise on a complex listing decision, Mansour Real Estate Group brings the same analytical discipline to every client conversation.
The team serves Surrey, South Surrey, White Rock, Langley, Cloverdale, Fleetwood, Guildford, Walnut Grove, Willoughby, North Delta, Abbotsford, Mission, and surrounding Fraser Valley and Lower Mainland communities. Most new clients come through referrals and repeat business from sellers who valued a process built on clear information, not market hype.
Related Articles
- Selling a Detached Home in Surrey: What to Expect in 2026
- Langley Real Estate Market Report 2026
- Selling a Condo in the Fraser Valley: What Sellers Need to Know in 2026
Official Resources
- Fraser Valley Real Estate Board — fvreb.bc.ca
- Canada Mortgage and Housing Corporation — cmhc-schl.gc.ca
- BC Assessment — bcassessment.ca
- BC Financial Services Authority — bcfsa.ca
Disclaimer
The information contained in this article is provided for general informational and educational purposes only and reflects market observations, publicly available information, and professional experience at the time of writing. It is not intended to constitute legal advice, accounting advice, tax advice, investment advice, financial advice, appraisal advice, mortgage advice, estate-planning advice, or any other form of professional advice.
Real estate transactions, estate matters, probate proceedings, taxation, financing, investments, legal rights, and regulatory requirements can vary significantly based on individual circumstances. Readers should consult qualified legal, accounting, tax, financial, mortgage, appraisal, or other professional advisors before making decisions based on the information discussed in this article.
Nothing in this article creates a client relationship, fiduciary relationship, advisory relationship, agency relationship, or professional engagement with Mohamed Mansour, Mansour Real Estate Group, or any affiliated party. Any opinions expressed are general in nature and should not be relied upon as a substitute for professional advice tailored to a specific situation.
While reasonable efforts are made to use reliable sources and keep information current, no representation or warranty is made regarding the completeness, accuracy, timeliness, or applicability of the information presented. Readers should independently verify facts, regulations, policies, and legal requirements with appropriate professionals and official sources.



