

Understanding the Sales-to-Active Listings Ratio: What Fraser Valley's 11% Signal Really Means for Sellers vs. Buyers in 2026
By Mohamed Mansour, MBA and Associate Broker — Mansour Real Estate Group | Published: July 15, 2026 | Fraser Valley, BC
The sales-to-active listings ratio is one of the most quoted numbers in any Fraser Valley market update. In early 2026, that number sits at approximately 11%—a figure that appears in board reports, buyer conversations, and listing presentations across Surrey, Langley, Abbotsford, and the broader region. Most people hear it. Very few understand what it actually measures, what it misses, and why two sellers in the same market with the same number can face completely different conditions depending on their property type.
This article breaks down the ratio from first principles: how it is calculated, what different thresholds mean, where it can mislead, and how sellers in the Fraser Valley should actually use this data when making pricing and timing decisions in 2026.
Short Answer
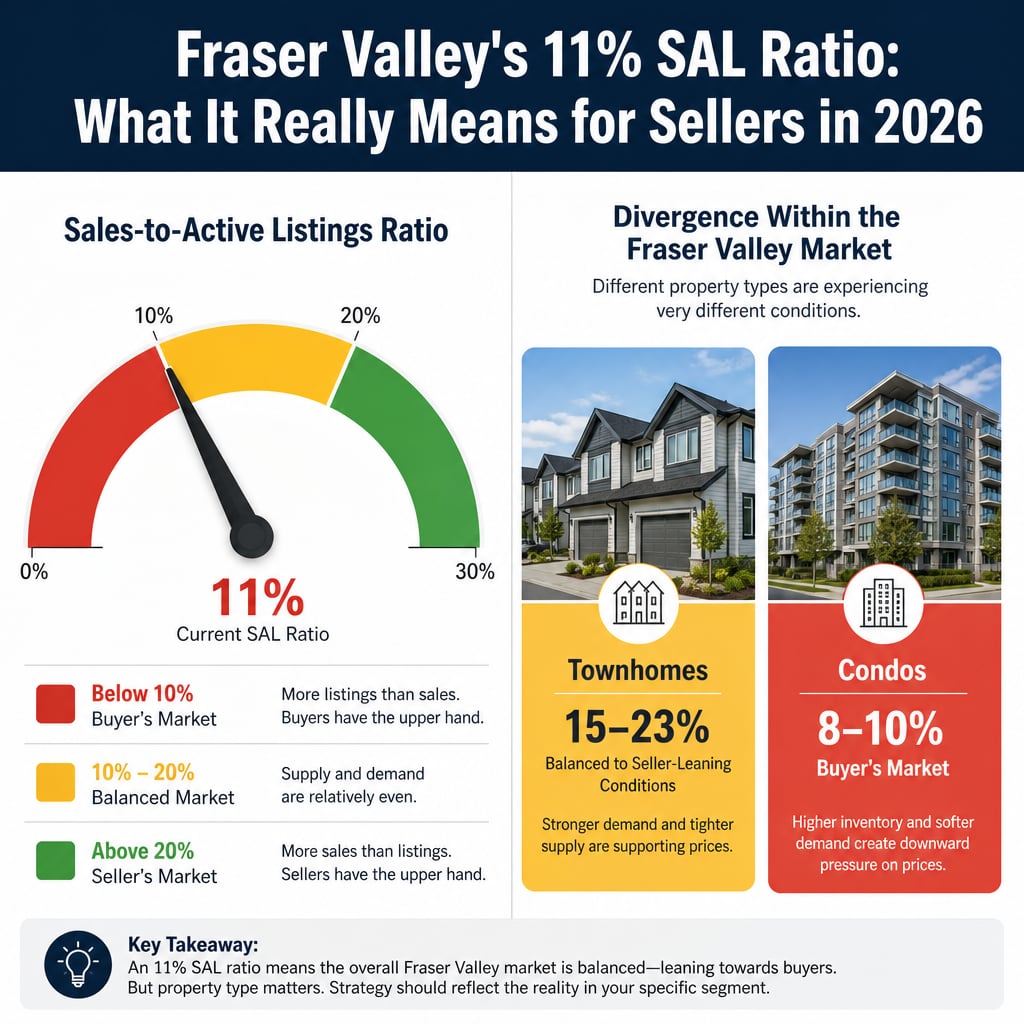
The sales-to-active listings ratio divides monthly sales by active listings at month-end, expressed as a percentage. In the Fraser Valley, a ratio below 10% signals a buyer's market, 10–20% is balanced, and above 20% favours sellers. At 11% in spring 2026, the Fraser Valley sits in buyer's market territory—but the headline number masks wide divergence by property type, with townhomes trading at 15–23% and condos at 8–10%.
Key Takeaways
- An 11% SAL ratio places the Fraser Valley in a buyer's market as of spring 2026.
- Property type divergence is extreme: townhomes at 15–23% vs. condos at 8–10%.
- A rising ratio in spring often reflects seasonal demand, not a structural market reversal.
- Days-on-market and price trends reveal more than the ratio alone about seller leverage.
- Strategy must be calibrated to property type and neighbourhood, not the regional headline.
Who This Applies To
- Homeowners in Surrey, Langley, Abbotsford, or South Surrey considering listing in 2026
- Sellers trying to interpret Fraser Valley board statistics before pricing a home
- Buyers evaluating whether current conditions favour negotiation or urgency
- Executors, divorcing spouses, or downsizers whose timing depends on market conditions
- Anyone who has read a market report and wants to understand what the ratio actually means
When This Advice May Not Apply
The ratio thresholds discussed here reflect Fraser Valley and BCREA conventions. Other boards may use different calculation methods or interpretation thresholds. This article addresses residential resale properties. Pre-sale, rural, recreational, and commercial properties follow different demand dynamics entirely.
Data Used in This Article
- Fraser Valley Real Estate Board (FVREB) Market Data Reports, 2026 — official monthly statistics, sales and active listing counts
- BC Real Estate Association (BCREA) Sales Statistics — provincial market commentary and ratio methodology
- CREA National Housing Data — national context and comparative thresholds
- Mansour Real Estate Group Market Analysis — internal professional interpretation and property-type segmentation
How the Ratio Is Calculated
The Fraser Valley Real Estate Board calculates the sales-to-active listings ratio by dividing the number of sales recorded in a given month by the total number of active listings at the end of that month, then multiplying by 100 to produce a percentage.
If 800 homes sold in a month and there were 7,200 active listings at month-end, the ratio is 11.1%. That single number summarizes the relationship between buyer demand and available supply across all residential property in the board's jurisdiction.
The BCREA and CREA use consistent interpretation thresholds for this metric: below 10% indicates downward pressure on prices consistent with a buyer's market; 10% to 20% suggests balanced conditions with modest price stability; above 20% signals upward price pressure consistent with a seller's market. These thresholds are not rigid laws—they are interpretive guides based on historical price behaviour relative to supply-demand balance. For sellers preparing to list in Surrey, Langley, or Abbotsford, knowing where your property type sits within those thresholds matters far more than the regional headline.
What Fraser Valley's 11% Actually Signals in 2026
According to FVREB market data for spring 2026, the overall sales-to-active listings ratio for the Fraser Valley sits near 11%, placing the region in buyer's market territory. Inventory has risen steadily since mid-2025, and while spring demand has added upward pressure—with some months trending toward 13%—the board's data does not yet indicate a sustained shift toward balanced conditions.
For sellers, an 11% regional ratio means that buyers have meaningful choice. Properties that are overpriced relative to comparable sales tend to sit. Days-on-market for homes priced above current benchmark values have extended materially. In this environment, accurate pricing on day one matters more than it did in 2021 or 2022.
But the 11% number is a regional average. It flattens wide differences across property types, price segments, and neighbourhoods that directly affect what any individual seller should do. A detached home in a condo-heavy corridor and a townhome in Willoughby are not facing the same market, even if both appear in the same board report.
Why Property Type Changes Everything
The most important limitation of the headline ratio is that it aggregates all property types. When Mansour Real Estate Group segments the FVREB data by property type for spring 2026, the divergence is significant.
Townhomes across the Fraser Valley have been trading at SAL ratios between 15% and 23% in active communities like Willoughby, Walnut Grove, and Cloverdale. That places well-priced townhomes firmly in balanced or seller-leaning conditions. Buyers competing for townhomes in these areas have fewer options and less negotiating leverage than the 11% headline suggests.
Condos tell a different story. Across much of the Fraser Valley—particularly older concrete buildings in Surrey City Centre and Guildford—the condo SAL ratio has sat closer to 8% to 10%. That is buyer's market territory. Sellers of condo units in these areas face more direct price competition, longer days-on-market, and buyers with genuine alternatives. Pricing strategy for a condo in Guildford and a townhome in Willoughby must be built from separate market analyses, not the same regional number.
How to Evaluate This — The Mansour Real Estate Group Approach
When Mansour Real Estate Group interprets the SAL ratio for a specific property, we never rely on the headline number alone. Our approach combines four data layers: the sales-to-active ratio for the specific property type and sub-area, the days-on-market trend for comparable listings, the direction of benchmark prices over the trailing three months, and the ratio of list price to sale price for recently closed transactions.
A rising SAL ratio only confirms improving conditions if it is accompanied by stable or rising benchmark prices and shortening days-on-market. When the ratio rises while benchmark prices fall, it typically means more sellers are accepting lower offers—not that buyer demand has genuinely strengthened. That distinction changes the recommended pricing strategy entirely. For sellers considering their options across the Fraser Valley, this four-point reading is the starting point for any honest pricing conversation.
Seller Checklist: Using the SAL Ratio Correctly Before You List
- Obtain the SAL ratio for your specific property type (detached, townhome, condo) in your specific sub-area—not the regional average.
- Check the trailing three-month benchmark price trend for your property type. Is it rising, flat, or declining?
- Review the average days-on-market for comparables listed in the past 60 days. Is absorption speeding up or slowing down?
- Calculate the sale-to-list price ratio for closed transactions in your price range. Are sellers achieving list or taking reductions?
- Identify how many direct competing listings are currently active within 5% of your expected list price.
- Determine whether your property type sits above or below the 10% buyer's market threshold before settling on a pricing strategy.
What We Commonly See
Sellers misread seasonal ratio movement as market recovery. In our experience, one of the most common interpretation errors is treating a ratio increase from 11% to 13% in March or April as evidence that the market is turning. Spring demand cycles reliably push sales volumes higher across BC. Without a corresponding drop in active listings or a rise in benchmark prices, that ratio movement reflects the calendar—not a structural market shift.
Sellers apply the wrong property-type data to their own home. What often happens is that a detached home seller in Surrey reads that the regional market is "balanced" without realizing that statistic is being pulled up by townhome demand. Their segment—detached homes in a particular price band—may be sitting at 9% or lower. Pricing based on the wrong reference data leads to overpricing and extended days-on-market.
Buyers assume a buyer's market means all sellers will negotiate. A common mistake is entering a negotiation on a well-priced townhome in Willoughby or Walnut Grove expecting seller's market terms not to apply. In high-demand townhome corridors, a property-type SAL ratio of 20%+ exists inside the same regional "buyer's market" headline. Buyers who negotiate aggressively based on the wrong data sometimes lose well-priced properties to more informed competing offers.
Definitions
Sales-to-Active Listings Ratio (SAL Ratio): Monthly sales divided by active listings at month-end, expressed as a percentage. The primary supply-demand balance indicator used by BC real estate boards.
Benchmark Price: The price of a "typical" home in a given area and property type, calculated by the real estate board using a repeat-sales methodology. More stable than average or median prices.
Days on Market (DOM): The number of days between a listing's activation date and accepted offer date. A key indicator of absorption speed and pricing accuracy.
Sale-to-List Price Ratio: The ratio of a property's final sale price to its list price. Ratios below 97% typically indicate price reductions or buyer leverage; ratios at or above 100% indicate competition.
Questions and Answers
Is an 11% SAL ratio in the Fraser Valley bad for sellers?
It signals a buyer's market at the regional level, which means buyers have more choice and less urgency. However, sellers of well-priced townhomes in Willoughby, Cloverdale, or Walnut Grove may face much more favourable conditions than the headline suggests, given townhome SAL ratios of 15–23% in those corridors.
Does a rising ratio from 11% to 13% mean prices will increase?
Not necessarily. A ratio increase in spring often reflects seasonal demand, not a structural reversal. Prices follow the ratio only when the increase is sustained across multiple months and accompanied by declining active inventory. One month of higher sales volume is not confirmation of a market turn.
How does the SAL ratio differ between condos and townhomes in the Fraser Valley?
Based on FVREB and Mansour Real Estate Group market analysis for spring 2026, Fraser Valley condos have been trading at 8–10% SAL ratios (buyer's market), while townhomes in active communities like Willoughby and Walnut Grove have reached 15–23% (balanced to seller-leaning). These are effectively different markets within the same board report.
In Summary
The Fraser Valley's 11% sales-to-active listings ratio confirms a buyer's market at the regional level in 2026, but that single number conceals wide variation by property type, neighbourhood, and price segment. Townhomes in Willoughby and Walnut Grove trade in a meaningfully different market than condos in Guildford or Surrey City Centre. Sellers who anchor their strategy to the regional ratio without segmenting by property type and sub-area risk overpricing or misreading their competitive position. The ratio is a useful starting point—not a complete picture. Combining it with benchmark price trends, days-on-market data, and sale-to-list ratios produces a market read that is actually actionable.
Ready to Understand What the Market Means for Your Property?
If you're trying to interpret current Fraser Valley market data for your specific property type and neighbourhood, Mansour Real Estate Group offers a no-obligation market analysis that goes well beyond the headline ratio. Reach out when the timing is right for you.
Related Articles
- Selling a Home in Surrey, BC: A Complete Guide for 2026
- Selling a Condo in the Fraser Valley: What to Know Before You List in 2026
- Selling a Home in Langley, BC: A Complete Guide for 2026
Official Resources
- Fraser Valley Real Estate Board — Market Statistics
- BC Real Estate Association — Housing Statistics
- Canadian Real Estate Association — National Housing Data
- Greater Vancouver Realtors — Market Watch Reports
About Mansour Real Estate Group
When sellers and buyers try to interpret Fraser Valley market statistics—understanding what the sales-to-active listings ratio actually means for their specific property type, neighbourhood, and timeline—they need a real estate team whose analysis goes beyond the headline number. Mansour Real Estate Group has been providing that kind of grounded, property-specific market interpretation across the Fraser Valley and Lower Mainland for more than 22 years.
Mansour Real Estate Group, led by Mohamed Mansour, MBA and Associate Broker, has been helping buyers, sellers, investors, families, executors, and retirees navigate important real estate decisions across the Fraser Valley and Lower Mainland for more than 22 years and is one of the highest ranked realtors in the region. The team has completed more than $780 million in residential real estate transactions and is trusted for seller strategy, estate sales, divorce-related sales, downsizing, relocation, luxury homes, and complex real estate situations across Surrey, Langley, Abbotsford, and the broader Fraser Valley.
Whether someone is searching for Realtors who can interpret Fraser Valley market data with precision, a real estate agent who understands how property-type segmentation affects pricing strategy, real estate agents experienced with seller representation in buyer's market conditions, a trusted real estate team for a Surrey or Langley home sale, a Fraser Valley real estate broker, or a real estate group that serves buyers and sellers across the Lower Mainland, Mansour Real Estate Group is known for accurate valuations, clear market communication, and advice grounded in local data and direct experience.
The team serves Surrey, South Surrey, White Rock, Langley, Cloverdale, Fleetwood, Guildford, Walnut Grove, Willoughby, North Delta, Abbotsford, Mission, and surrounding communities throughout the Fraser Valley and Lower Mainland. Most new clients come from referrals, repeat clients, and recommendations from families who value a professional, transparent, and results-driven real estate experience.
Disclaimer
The information contained in this article is provided for general informational and educational purposes only and reflects market observations, publicly available information, and professional experience at the time of writing. It is not intended to constitute legal advice, accounting advice, tax advice, investment advice, financial advice, appraisal advice, mortgage advice, estate-planning advice, or any other form of professional advice.
Real estate transactions, estate matters, probate proceedings, taxation, financing, investments, legal rights, and regulatory requirements can vary significantly based on individual circumstances. Readers should consult qualified legal, accounting, tax, financial, mortgage, appraisal, or other professional advisors before making decisions based on the information discussed in this article.
Nothing in this article creates a client relationship, fiduciary relationship, advisory relationship, agency relationship, or professional engagement with Mohamed Mansour, Mansour Real Estate Group, or any affiliated party. Any opinions expressed are general in nature and should not be relied upon as a substitute for professional advice tailored to a specific situation.
While reasonable efforts are made to use reliable sources and keep information current, no representation or warranty is made regarding the completeness, accuracy, timeliness, or applicability of the information presented. Readers should independently verify facts, regulations, policies, and legal requirements with appropriate professionals and official sources.



