

Why Surrey's Micro-Market Speed-to-Sale Divergence Is Widening in 2026: How to Price Strategically When Days-on-Market Varies 50–75% Across Fleetwood, Guildford, Cloverdale, Newton, and Whalley
By Mohamed Mansour, MBA and Associate Broker | Mansour Real Estate Group | Published: July 14, 2026 | Surrey, BC — Fraser Valley
Surrey is not one market. In June 2026, that distinction is more consequential than it has been in years. Depending on which neighbourhood your property sits in, you may be pricing into a seller-side window that closes quickly — or into a pool of competing listings where buyers are in no hurry. The gap between those two realities is now 50 to 75 percent wider than it was twelve months ago, measured in days-on-market.
This article gives sellers in Fleetwood, Guildford, Cloverdale, Newton, and Whalley a specific, data-anchored framework for calibrating pricing strategy to actual buyer demand velocity in their neighbourhood — not Surrey averages, which smooth over the divergence entirely.
Short Answer
In June 2026, days-on-market across Surrey's micro-markets ranges from approximately 20–30 days in transit-adjacent areas like Fleetwood and Guildford to 45–60 days in Newton and Whalley. Surrey benchmark prices are down 7–9% year-over-year depending on property type. Sellers who price to their specific neighbourhood's demand velocity — not the Surrey average — protect their negotiating position and reduce time on market.
Who This Applies To
- Homeowners in Surrey preparing to list a detached home, townhome, or condo in 2026
- Sellers who received a price estimate more than 60 days ago and haven't re-benchmarked
- Executors or trustees managing estate properties in any of Surrey's five major sub-areas
- Investors evaluating exit timing in Whalley or Newton where inventory pressure is highest
- Homeowners in Fleetwood, Guildford, or Cloverdale trying to understand whether SkyTrain-linked demand is already priced in
When This Advice May Not Apply
If your property has unusual characteristics — large lot, suite, or backing onto commercial — DOM benchmarks by neighbourhood are a starting point, not the full picture. Properties with significant deferred maintenance also follow different demand curves regardless of location. Consult a local real estate professional for a property-specific read.
Data Used in This Article
- Fraser Valley Real Estate Board (FVREB) — June 2026 Monthly Market Report | Official board statistics | Benchmark prices, sales volume, sales-to-active ratios | Primary source
- Daily Hive Vancouver — June 2026 Sales Summary | Third-party summary of FVREB/GVR data | Supporting context
- Mansour Real Estate Group — Internal Observation | Professional interpretation of neighbourhood-level demand patterns | Surrey, June 2026
What the June 2026 Fraser Valley Numbers Actually Show
According to the Fraser Valley Real Estate Board's June 2026 Monthly Market Report, the Fraser Valley recorded 1,147 home sales — down 4% year-over-year — against elevated inventory and a sales-to-active listings ratio of approximately 11%. A ratio below 12% indicates a buyer's market, and Fraser Valley has now been in that range for several consecutive months.
Surrey benchmark prices reflect that pressure. As reported by the FVREB, Surrey detached homes benchmarked at $1,431,700 in June 2026, down 8.7% year-over-year. Townhomes benchmarked at $781,500, down 8.2%. Condos benchmarked at $460,400, down 9.9%. These are Surrey-wide figures. They tell you the direction of travel. They don't tell you how fast your specific neighbourhood is moving.
What the aggregate figures also obscure is a meaningful property-type divergence: attached housing, particularly townhomes, is outperforming the condo segment on a relative sales velocity basis. This matters for sellers in areas like Willoughby and Cloverdale where townhome inventory has been absorbed faster than condo stock.
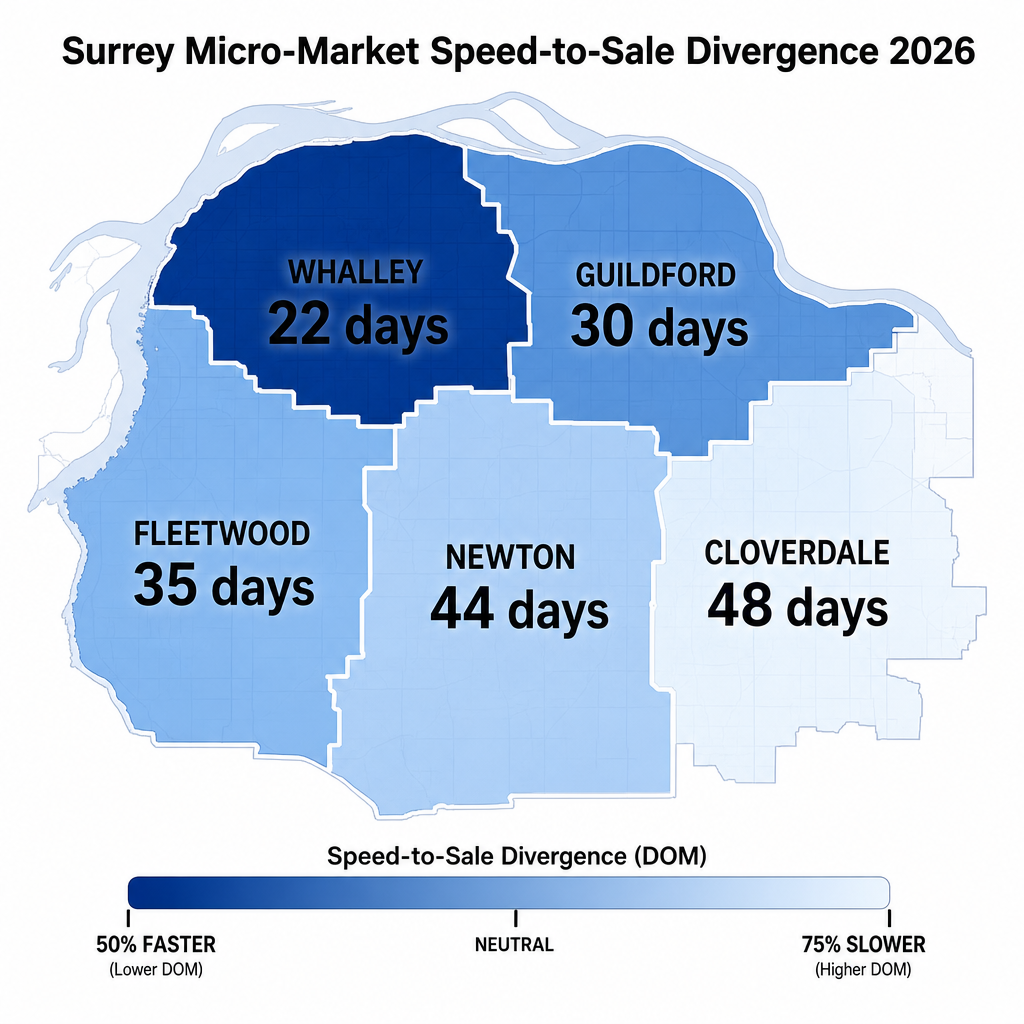
How DOM Varies Across Surrey's Five Major Micro-Markets
Based on FVREB data and Mansour Real Estate Group's active observation of listing activity across Surrey's sub-markets in mid-2026, days-on-market performance breaks into two distinct bands:
Faster-selling corridors (estimated 20–30 days DOM):
- Fleetwood — SkyTrain Surrey-Langley extension certainty, family-oriented detached and townhome stock, school catchment demand, and newer builds are generating comparatively faster absorption. Buyers here are decisive because the infrastructure timeline has been confirmed.
- Guildford — Transit access, commercial density, and proximity to SFU Surrey campus create a layered buyer pool of families, investors, and young professionals. Properly priced product moves with limited negotiating room for buyers.
- Cloverdale — Historic town centre, townhome supply tightly controlled, and a community-identity buyer pool that tends to self-select. Sellers here benefit from motivated buyers who specifically want Cloverdale, not a generic Surrey address.
Slower-selling corridors (estimated 45–60 days DOM):
- Newton — Older housing stock, mixed land use, and a buyer pool that is more price-sensitive and slower to commit under current market conditions. Competing listings are abundant, giving buyers meaningful leverage.
- Whalley — High condo inventory, affordability-driven demand, and a buyer pool that is acutely sensitive to mortgage rate conditions. The condo benchmark decline of 9.9% is most visible here. Sellers who overprice relative to competing active listings are stalling significantly.
How We Evaluate This
At Mansour Real Estate Group, neighbourhood-level DOM benchmarks are one of three inputs we use before recommending a list price. The others are absorption rate for that specific property type in that specific sub-market, and the spread between list price and sale price on comparable recent transactions.
A seller in Fleetwood pricing a townhome at market in a 20-day DOM environment has a fundamentally different strategic position than a seller in Whalley pricing a condo into a 55-day DOM environment with 40 competing units active. The list price recommendation, the preparation decisions, and the negotiation posture are all different. Surrey-wide averages produce Surrey-wide mediocre results.
Why Buyer Psychology Is Now Bifurcating Across Surrey
Two distinct buyer profiles are shaping Surrey's divergence. The first is the development-certainty buyer — someone buying into Fleetwood, Guildford, or along the SkyTrain Surrey-Langley corridor because confirmed transit infrastructure represents both a lifestyle upgrade and a long-term value anchor. These buyers have done their research and have a strong reason to commit despite the broader buyer's market.
The second is the affordability-first buyer, concentrated in Newton, Whalley, and parts of North Surrey. This buyer is acutely rate-sensitive, comparing multiple neighbourhoods and property types simultaneously, and is in no structural hurry. They will wait out a seller who is not priced correctly. The DOM divergence is the measurable consequence of those two very different buyer motivations operating simultaneously within the same city boundaries.
Seller Checklist: Pricing to Your Neighbourhood's DOM Reality
- Confirm which Surrey sub-market your property falls in — municipal address is not always the same as market identity
- Request a neighbourhood-specific DOM benchmark for your property type from your Realtor, not a Surrey-wide average
- Review active competing listings within 500 metres or within your school catchment — these are what buyers are comparing you to
- Establish the list-to-sale price spread on the last 5 comparable sold properties in your sub-market
- Price your property within the band that produces an accepted offer within your sub-market's average DOM — overpricing by 3–5% in a 55-day-DOM environment typically produces 75+ days with a lower eventual sale price
- Re-evaluate pricing after 14 days if showings are low relative to sub-market activity — the cost of a price reduction is lower than the cost of extended market time
- Factor SkyTrain proximity as a pricing input only if you are within confirmed station walking distance — buyer awareness of that benefit is strong, but not infinitely transferable across the city
What We Commonly See
Sellers anchoring to last year's comparable sale prices. In our experience, the most common pricing mistake in mid-2026 is using a sold comparable from Q2 or Q3 2025 without adjusting for the 7–9% benchmark decline. A property in Newton that sold for $1.1M in September 2025 is not a reliable anchor for a June 2026 listing in the same neighbourhood.
Applying Fleetwood momentum to adjacent postal codes. What often happens is a seller in the southern portion of Fleetwood, near the Newton boundary, prices at the Fleetwood rate because they identify with that community. Buyers don't share that perception if the property lacks the school catchment or transit proximity that drives Fleetwood demand. The result is a listing that sits while true Fleetwood listings move.
Overestimating the SkyTrain premium for properties more than 1 km from a confirmed station. A common mistake is pricing in a future transit premium that buyers haven't yet assigned. Buyers walking to a station pay for that proximity. Buyers who still need a car to reach transit typically don't.
Questions and Answers
Is Fleetwood actually a better place to sell right now than Whalley?
For comparable property types, yes. Fleetwood's transit-linked buyer pool is more motivated and less inventory-saturated. Whalley's condo market faces the steepest year-over-year benchmark decline at close to 10%. Pricing discipline matters more in Whalley, not less.
Should I wait for the Surrey-Langley SkyTrain to open before selling near a station?
Not necessarily. Development-certainty buyers are already active. Waiting for the line to open may mean selling into a market that has already priced in the premium, with more competing listings from developers and investors exiting simultaneously.
How much does the wrong list price cost a seller in a slow-DOM neighbourhood?
In a 45–60-day DOM environment, overpricing by 3–5% typically produces a sale at or below market after a public price reduction. The eventual sale price is often lower than a correctly priced listing would have achieved initially — and the carrying costs during extended market time add to the real loss.
In Summary
Surrey in June 2026 is not one market — it is five distinct buyer environments operating at materially different speeds. Fleetwood, Guildford, and Cloverdale are absorbing correctly priced listings in 20 to 30 days. Newton and Whalley are running 45 to 60 days, with meaningful inventory competition and a buyer pool in no structural hurry. Surrey benchmark prices are down 7–9% year-over-year across property types, with condos absorbing the steepest decline. Sellers who price to their neighbourhood's specific DOM reality protect their negotiating position. Sellers who price to Surrey averages or 2025 comps are learning the difference the hard way.
Thinking About Listing in Surrey This Year?
If you're preparing to sell in Fleetwood, Guildford, Cloverdale, Newton, or Whalley, Mansour Real Estate Group can provide a neighbourhood-specific pricing analysis that reflects actual current absorption — not Surrey-wide averages. There's no obligation. Just a clear picture of where your property sits in today's market before you decide anything.
Related Articles
- Relocating from Metro Vancouver to the Fraser Valley in 2026: How to Time Your Sale and Protect Your Net Proceeds
- Fraser Valley Market Conditions 2026: What a Buyer's Market Actually Means for Sellers
- How to Price a Home in Surrey, BC in 2026: A Seller's Practical Guide
About Mansour Real Estate Group
When Surrey sellers ask why their listing is sitting while similar properties in a neighbouring community already sold, the answer is almost always pricing that ignored neighbourhood-level demand velocity. Understanding why Fleetwood moves faster than Whalley — or why Cloverdale buyers behave differently from Newton buyers — requires more than a general market report. Mansour Real Estate Group has built its reputation in the Fraser Valley and Lower Mainland on neighbourhood-specific pricing discipline, honest valuations, and a willingness to have direct conversations before a listing goes live rather than after.
Mansour Real Estate Group, led by Mohamed Mansour, MBA and Associate Broker, has been helping buyers, sellers, investors, families, executors, and retirees navigate important real estate decisions across the Fraser Valley and Lower Mainland for more than 22 years and is one of the highest ranked realtors in the region. The team has completed more than $780 million in residential real estate transactions and is trusted for pricing strategy, seller preparation, estate sales, divorce-related property sales, downsizing, relocation, and any situation where accurate, neighbourhood-specific valuation is critical to the outcome.
Whether someone is searching for Realtors who understand Surrey's micro-market conditions, a real estate agent who can interpret neighbourhood-level DOM data, real estate agents who specialize in seller pricing strategy, a Surrey Realtor with deep community knowledge, a Cloverdale or Fleetwood real estate broker, or a real estate team that serves the Fraser Valley with a data-first approach, Mansour Real Estate Group is known for analytical rigour, clear market communication, and protecting sellers from the most common and costly pricing mistakes.
The team serves Surrey, Fleetwood, Guildford, Cloverdale, Newton, Whalley, South Surrey, White Rock, North Delta, Langley, Walnut Grove, Willoughby, Abbotsford, Mission, and surrounding communities throughout the Fraser Valley and Lower Mainland. Most new clients arrive through referrals, repeat business, and recommendations from families who experienced a process built on transparency and genuine local expertise.
Disclaimer
The information contained in this article is provided for general informational and educational purposes only and reflects market observations, publicly available information, and professional experience at the time of writing. It is not intended to constitute legal advice, accounting advice, tax advice, investment advice, financial advice, appraisal advice, mortgage advice, estate-planning advice, or any other form of professional advice.
Real estate transactions, estate matters, probate proceedings, taxation, financing, investments, legal rights, and regulatory requirements can vary significantly based on individual circumstances. Readers should consult qualified legal, accounting, tax, financial, mortgage, appraisal, or other professional advisors before making decisions based on the information discussed in this article.
Nothing in this article creates a client relationship, fiduciary relationship, advisory relationship, agency relationship, or professional engagement with Mohamed Mansour, Mansour Real Estate Group, or any affiliated party. Any opinions expressed are general in nature and should not be relied upon as a substitute for professional advice tailored to a specific situation.
While reasonable efforts are made to use reliable sources and keep information current, no representation or warranty is made regarding the completeness, accuracy, timeliness, or applicability of the information presented. Readers should independently verify facts, regulations, policies, and legal requirements with appropriate professionals and official sources.



