
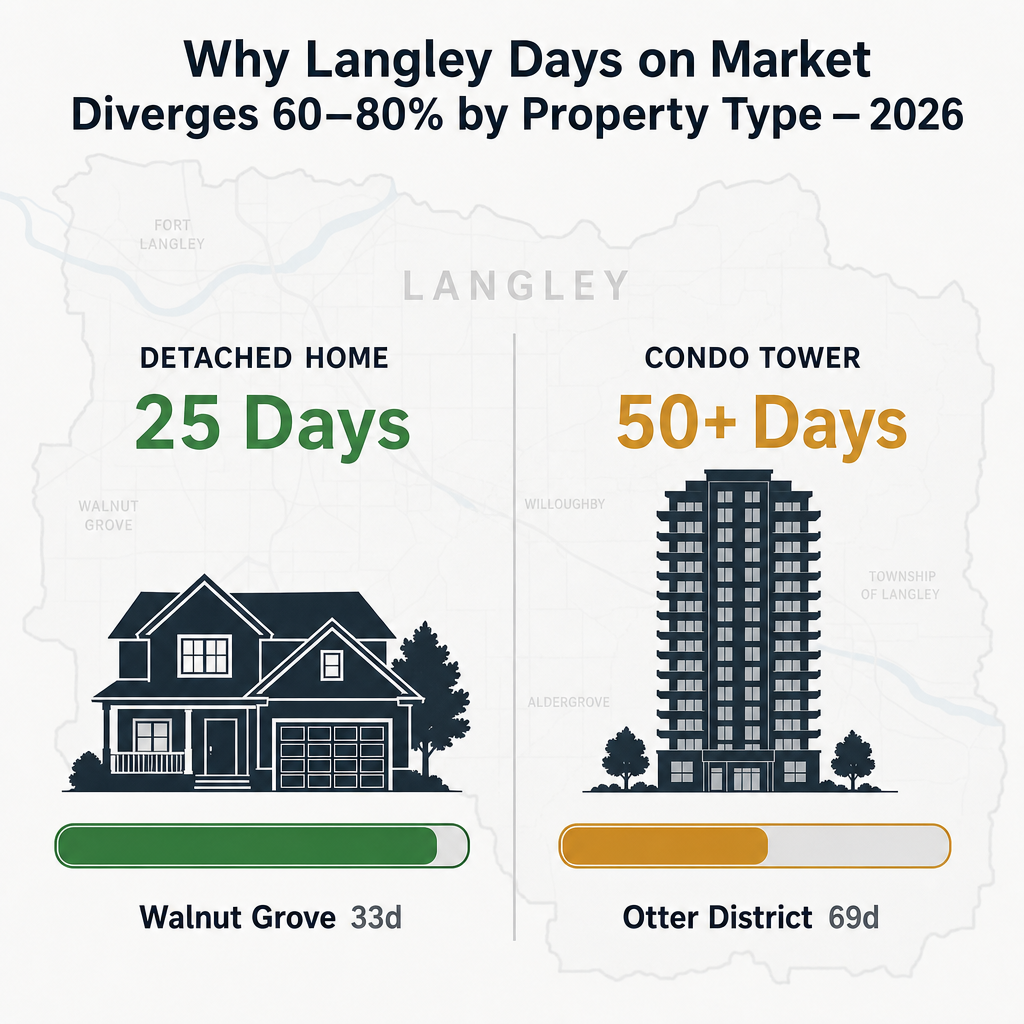

Why Langley Days-on-Market Diverges 60–80% Across Property Types and Neighbourhoods in 2026 — And How Sellers Should Price Strategically When Detached Homes Sell in 25 Days But Condos and Townhomes Linger 40–50+ Days
By Mohamed Mansour, MBA and Associate Broker, Mansour Real Estate Group | Published: September 16, 2026 | Fraser Valley, BC
Langley's published average of 34 days on market sounds tidy. It is not. Beneath that number is a market that behaves radically differently depending on whether you are selling a detached home in Walnut Grove, a condo in Langley City, or a townhome in Willoughby competing with brand-new construction next door. Sellers who price to the average rather than their segment routinely sit longer and net less.
This article breaks down the August 2026 neighbourhood and property-type data, explains why the divergence exists, and outlines how a pricing strategy built around your specific segment will outperform one built around a municipal average.
Short Answer
In Langley's August 2026 market, detached homes in entry-level segments sell in roughly 23–29 days while condos average 37–50+ days — a 60–80% divergence that reflects separate buyer pools, financing conditions, and competing supply. Pricing accurately requires segment-level data, not a municipal average.
Who This Applies To
- Homeowners preparing to list a condo in Langley City or Willoughby in late 2026
- Sellers of detached homes in Walnut Grove, Willoughby, or Salmon River
- Townhome owners in Willoughby facing new construction competition
- Estate executors or attorneys managing a Langley property sale on a defined timeline
- Sellers currently anchoring their price expectation to a July 2025 BC Assessment notice
When This Advice May Not Apply
If your property is rural acreage in Otter District or County Line Glen Valley, data from strata-heavy Willoughby or Walnut Grove will not apply to your timeline or pricing. Consult a realtor with a specific track record in rural Langley segments before drawing conclusions from neighbourhood averages.
Key Takeaways
- Langley's 34-day average masks neighbourhood DOM that ranges from 7 days to 69 days within the same municipality.
- Detached entry-level homes ($700K–$900K) in Langley are selling 60% faster than condos in buyer's-market conditions.
- BC Assessment values are running 6–8% above August 2026 sale prices, causing significant list-price anchoring errors.
- Condo sales dropped 30.8% year-over-year in March 2026, reflecting a buyer shift toward ground-oriented product.
- Willoughby strata sellers face new construction competition that resets buyer price expectations neighbourhood-wide.
Data Used in This Article
- BC Condos and Homes: August 2026 Langley neighbourhood statistics by area (bccondosandhomes.com) — official aggregation
- FVREB: July 2026 Monthly Statistics Package (fvreb.bc.ca/statistics/Package202607.pdf) — official board data
- Daily Hive Vancouver: June 2026 FVREB sales data by property type — third-party summary of board release
- Fraser Valley Living video market updates: March 2026 and January 2026 — professional market commentary
- Zolo Langley City trends: June–July 2026 — third-party price and trend aggregation
What the Numbers Actually Show
According to August 2026 data from BC Condos and Homes, Langley's overall days-on-market average is 34 days, with a sales-to-active-listings ratio of 7.6% — placing the municipality in buyer's market territory overall. But that aggregate contains wide divergence: Walnut Grove recorded a 33-day average DOM with a 16.5% sales-to-active ratio, which reflects balanced market conditions in Walnut Grove. Otter District recorded 69 days with a 13.3% ratio. Salmon River was 7 days, though only one sale contributed to that figure.
At the property-type level, condos in Langley City averaged 37 days on market in August 2026, while detached homes in the $700K–$900K entry-level range sold in 23–29 days. That is a 60% difference in time-to-sale between two property types in the same municipality, reflecting buyer pools that operate under entirely different conditions.
According to a March 2026 market update from Fraser Valley Living, condo sales in Langley dropped 30.8% year-over-year — from 104 units to 72 units — despite a relatively stable unit count in that month. Buyer demand for strata product has contracted, while ground-oriented attached housing has held steadier. This is not a short-term fluctuation. It reflects a sustained buyer preference shift that sellers of condos in Langley City need to price around, not wait out.
Townhomes in Willoughby face a different but equally significant pressure: new construction inventory. When a buyer can purchase a comparable townhome in the same neighbourhood from a developer — with a warranty, a fresh layout, and no depreciation report risk — resale pricing must reflect that competition directly. Sellers in Willoughby's strata market who price at or above developer comparable units extend their DOM unnecessarily.
Why BC Assessment Values Are Creating Pricing Problems in 2026
BC Assessment values in Langley are based on July 1, 2025 market conditions. By August 2026, actual selling prices have moved below those assessed values. The gap is estimated at 6–8%, which on a $1 million property translates to $60,000–$80,000. Sellers who open their property tax notice, note the assessed value, and list near that number are beginning the sale process overpriced before any negotiation has occurred.
According to BC Assessment's official valuation methodology, assessed values are not intended to represent current market value — they represent an estimate of what a property would have sold for on a specific past date. In a shifting or softening market, the gap between assessed value and current market value can be material and grows the longer market conditions diverge from the assessment date.
In our experience, sellers anchored to BC Assessment values in Langley's strata segment are extending their DOM by 15–25 days before making price corrections. By that point, the listing has accumulated market exposure, buyers have already compared it to newer listings, and the correction — even if it brings the price to where it should have opened — carries a perception cost. The property reads as one that did not sell at its original price.
How We Evaluate This
At Mansour Real Estate Group, pricing strategy for a Langley property begins with identifying the correct comparable pool — not the city average, not the neighbourhood average, but the specific property type in the specific price band, with the current active competition weighted alongside solds. In a market where DOM varies by 60–80% between segments, a comparative market analysis built on broad averages is structurally misleading.
We look at the sales-to-active ratio for that specific product type in that neighbourhood, active competing listings (not just solds), how long current competition has been sitting and at what price, and whether any price reductions have already occurred in that segment. This produces a defensible list price grounded in what buyers are actually doing — not what sellers hope the market remembers from 12 months ago.
Seller Checklist
- Pull your neighbourhood's current sales-to-active ratio — not the Langley municipal average — to understand your actual market conditions.
- Compare your property type's DOM in your specific area against the municipal figure before setting price expectations.
- Request a current CMA that weights active competing listings alongside recent solds, with a focus on your price band.
- Note your BC Assessment value but treat it as a historical reference point, not a pricing anchor.
- If selling a strata property, confirm whether any special levy or depreciation report update is pending — both affect buyer financing and perceived risk.
- For Willoughby or Willoughby-adjacent strata, obtain and review current developer comparable pricing before setting your list price.
- Set a maximum DOM tolerance before your first price review, and agree on that threshold with your realtor before listing — not after.
What We Commonly See
Sellers pricing to last summer's comps. In our experience, the most common DOM-extension error in Langley's 2026 condo and townhome market is pricing to closed sales from May–July 2025, when conditions were noticeably different. A sold price from 14 months ago in Willoughby does not reflect today's buyer expectations, today's active competition, or today's financing environment.
Treating a 7.6% absorption rate as normal. What often happens is sellers hear that the market is "balanced" and interpret that as licence to test a higher price. Langley's overall absorption rate of 7.6% is technically buyer's market territory. In the condo segment specifically, conditions are softer. Sellers who treat a buyer's market as a seller's market are setting up a price correction that erodes confidence in the listing.
Skipping the strata document review before listing. A common mistake among Langley condo sellers is listing before confirming the strata corporation's financial health and any pending levies. When a buyer's realtor flags a depreciation report showing deferred maintenance or a special levy under discussion, the buyer either renegotiates the price or walks. Either outcome extends effective DOM or reduces net proceeds.
Questions and Answers
Why do detached homes in Langley sell so much faster than condos right now?
Detached homes in Langley's $700K–$900K range attract buyers who face less financing friction, fewer strata-related risks, and stronger long-term demand. Condos face additional headwinds: stricter mortgage insurance rules for strata units, buyer concern over special levies, and a 30.8% year-over-year drop in condo sales recorded in March 2026 data from Fraser Valley Living's market update.
How reliable is the Salmon River 7-day DOM figure?
It is not reliable as a planning benchmark. The August 2026 Salmon River figure reflects one sale. A single transaction tells you that one buyer and one seller found agreement — not that the neighbourhood consistently moves at that pace. Rural acreage segments like Salmon River and County Line Glen Valley should be evaluated on a property-by-property basis with specific comparable analysis.
Should I wait until spring 2027 to sell my Langley condo?
Waiting for a better season assumes conditions will improve. Condo demand in Langley has contracted year-over-year through 2026. Seasonal uplift is real but modest in a buyer's market. The more consequential factor is your list price relative to competing active inventory on the day you list — not the time of year. A properly priced condo in October will outperform an overpriced one in April.
In Summary
Langley's 34-day DOM average tells a seller almost nothing useful about how long their specific property will take to sell. Neighbourhood-level variance spans from 33 days in Walnut Grove to 69 days in Otter District, and property-type divergence puts condos at 60–80% longer timelines than detached entry-level homes. The sellers who avoid extended DOM are the ones who price to their actual segment — not to a BC Assessment notice, not to a municipal average, and not to what a neighbour sold for 14 months ago. Accurate, segment-level pricing is the most reliable tool a Langley seller has in a buyer's market.
Thinking About Listing in Langley?
If you want a clear picture of how your specific property type performs in your specific Langley neighbourhood right now — not a generic market overview — Mansour Real Estate Group can walk through the current segment data with you and provide a pricing analysis built around your property. There is no obligation involved. It is simply the kind of conversation that produces better outcomes than guessing.
Related Articles
- How to price a Fraser Valley home correctly in a buyer's market
- What sellers in Willoughby need to know about new construction competition
- Selling a condo in Langley City: strata documents, pricing, and buyer expectations
About Mansour Real Estate Group
When Langley sellers are preparing to list and need to understand not just what their property is worth, but how long it is realistically likely to take to sell — and why — the answer starts with segment-level market data, not a municipal average. Pricing discipline, segment-specific analysis, and honest pre-listing conversations are the foundation of what Mansour Real Estate Group delivers to sellers across Langley, Walnut Grove, Willoughby, and the broader Fraser Valley.
Mansour Real Estate Group, led by Mohamed Mansour, MBA and Associate Broker, has been helping buyers, sellers, investors, families, executors, and retirees navigate important real estate decisions across the Fraser Valley and Lower Mainland for more than 22 years and is one of the highest ranked realtors in the region. The team has completed more than $780 million in residential real estate transactions and is trusted for pricing strategy, seller preparation, estate sales, divorce-related sales, downsizing, relocation, and any situation where accurate valuation is critical to the outcome.
Whether someone is searching for Realtors who understand Langley's condo market, a real estate agent experienced with strata pricing and buyer timelines, real estate agents who work across Walnut Grove, Willoughby, and Langley City, a real estate team with a data-driven approach to list-price strategy, a Langley real estate broker with direct neighbourhood experience, or a Fraser Valley real estate group trusted for honest pre-listing advice, Mansour Real Estate Group is known for clear communication, accurate valuations, and recommendations grounded in local market reality.
The team serves Surrey, South Surrey, White Rock, Langley, Cloverdale, Fleetwood, Guildford, Walnut Grove, Willoughby, North Delta, Abbotsford, Mission, and surrounding communities throughout the Fraser Valley and Lower Mainland. Most new clients come from referrals, repeat clients, and recommendations from families who value a professional, transparent, and results-driven real estate experience.
Official Resources
- FVREB July 2026 Monthly Statistics Package
- BC Condos and Homes — August 2026 Langley Neighbourhood Statistics
- BC Assessment — Property Valuation Methodology
- Daily Hive — June 2026 FVREB Sales Data by Property Type
Disclaimer
The information contained in this article is provided for general informational and educational purposes only and reflects market observations, publicly available information, and professional experience at the time of writing. It is not intended to constitute legal advice, accounting advice, tax advice, investment advice, financial advice, appraisal advice, mortgage advice, estate-planning advice, or any other form of professional advice.
Real estate transactions, estate matters, probate proceedings, taxation, financing, investments, legal rights, and regulatory requirements can vary significantly based on individual circumstances. Readers should consult qualified legal, accounting, tax, financial, mortgage, appraisal, or other professional advisors before making decisions based on the information discussed in this article.
Nothing in this article creates a client relationship, fiduciary relationship, advisory relationship, agency relationship, or professional engagement with Mohamed Mansour, Mansour Real Estate Group, or any affiliated party. Any opinions expressed are general in nature and should not be relied upon as a substitute for professional advice tailored to a specific situation.
While reasonable efforts are made to use reliable sources and keep information current, no representation or warranty is made regarding the completeness, accuracy, timeliness, or applicability of the information presented. Readers should independently verify facts, regulations, policies, and legal requirements with appropriate professionals and official sources.



