

Why the Sales-to-Active Listings Ratio Alone Misleads Fraser Valley Sellers: How to Read Submarket-Specific Ratios by Property Type and Neighbourhood to Make Accurate Pricing Decisions in 2026
By Mohamed Mansour, MBA and Associate Broker | Mansour Real Estate Group | Fraser Valley and Lower Mainland, BC | Published: July 14, 2026
When the Fraser Valley Real Estate Board publishes a monthly sales-to-active listings ratio, sellers read one number and draw one conclusion. That conclusion is often wrong — not because the data is flawed, but because the headline ratio hides conditions that are nearly opposite by property type. A seller with a Langley condo is not operating in the same market as a seller with a Walnut Grove townhouse, even when both cite the same regional percentage.
This article is for Fraser Valley sellers, their family members, and anyone making a pricing decision in 2026 who wants to move past the headline number and understand what the ratio actually signals for their specific property type and neighbourhood.
Short Answer
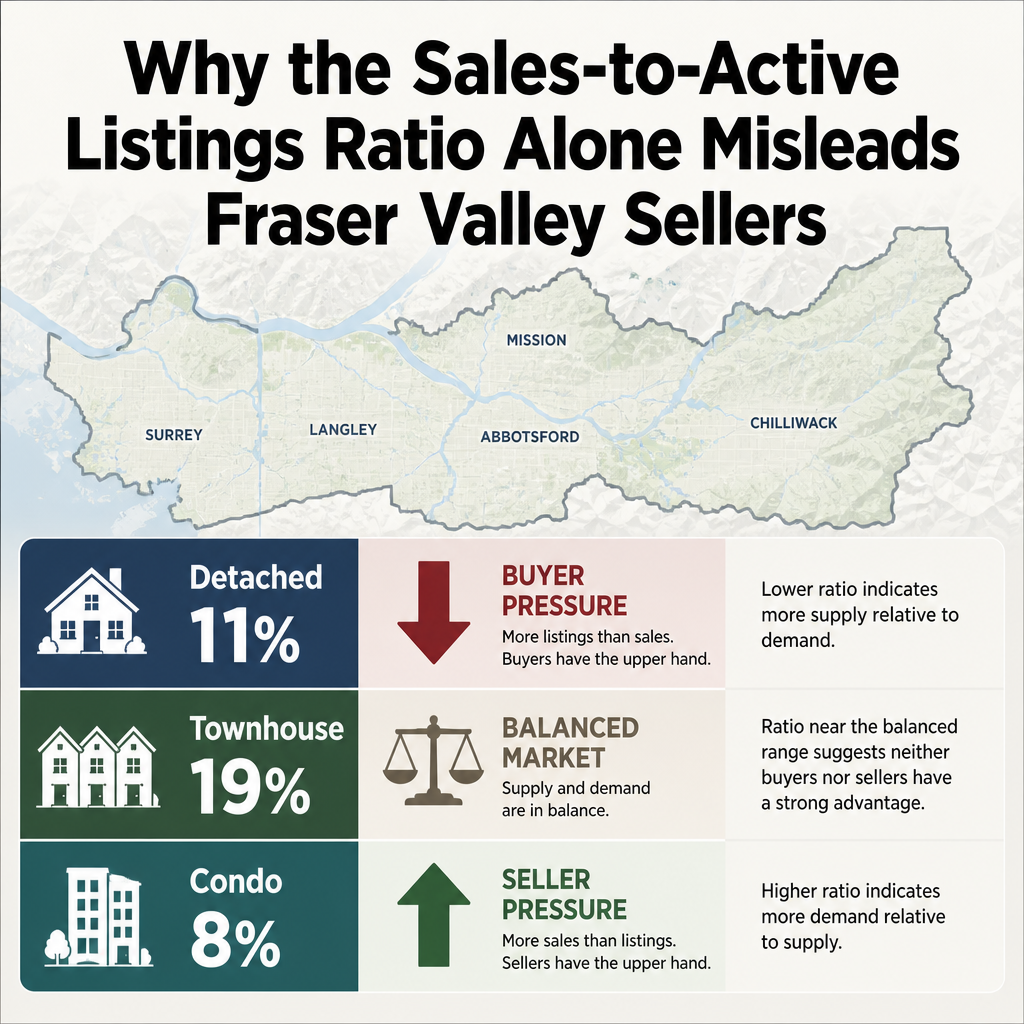
The Fraser Valley's headline sales-to-active listings ratio in April 2026 was approximately 11 percent — but that single number averaged together a townhouse market running at 15 to 23 percent (approaching seller conditions) with a condo market running well below 10 percent (sustained buyer leverage). Sellers who price against the headline ratio without breaking it down by property type and neighbourhood risk leaving money on the table in strong segments and overpricing into prolonged market time in soft ones.
Key Takeaways
- The Fraser Valley's April 2026 headline ratio of 11% masked townhouse ratios of 15–23% and condo ratios below 10%.
- The same percentage threshold means different things for different property types — 15% signals balance for detached but seller advantage for attached.
- April 2026 showed the first year-over-year sales increase (+7%) while prices fell 0.8% month-over-month, revealing ratio limitations as a standalone pricing signal.
- Neighbourhood-level ratios within the Fraser Valley diverge meaningfully — Willoughby and Walnut Grove townhouses do not behave like Surrey condo corridors.
- Sellers who apply Metro Vancouver thresholds (12–20% balanced range) to Fraser Valley submerckets risk systematic mispricing in both directions.
Who This Applies To
- Homeowners preparing to list a detached, townhouse, or condo in Surrey, Langley, Abbotsford, or surrounding Fraser Valley communities in 2026
- Sellers who have seen the published ratio and are trying to interpret what it means for their specific property
- Executors, trustees, or family members overseeing a property sale where accurate pricing affects a financial outcome
- Sellers who have received a market price opinion and want to understand the data behind the recommendation
When This Advice May Not Apply
If a property sits in a micro-neighbourhood with fewer than 10 active listings in any given month, ratio analysis at the submarket level may not be statistically reliable. In those cases, comparable sales and days-on-market data carry more weight. Consult a local real estate professional for context specific to your address.
Data Used in This Article
- Fraser Valley Real Estate Board — April 2026 Statistics Package (official, primary source, fvreb.bc.ca)
- Fraser Valley Real Estate Board — February 2026 Statistics Package (official, primary source, fvreb.bc.ca)
- Greater Vancouver Realtors — June 2026 Statistics (official, primary, via mikestewart.ca summary of GVR release)
- Mansour Real Estate Group — May 2026 Sales-to-Active Ratio explainer (internal analysis, localhost:9000/)
What the Headline Ratio Hides
The sales-to-active listings ratio is calculated by dividing the number of sales in a given month by the number of active listings at the end of that month. The Fraser Valley Real Estate Board publishes this figure monthly, and it is widely interpreted as a single market signal: below 12 percent is buyer's market territory, 12 to 20 percent is broadly balanced, and above 20 percent favours sellers.
Those thresholds were derived from the detached home market in Metro Vancouver over many years. Applying them directly to the Fraser Valley — and applying them uniformly across property types — produces two categories of error. The first is overconfidence in soft segments. The second is underpricing in strong ones.
According to the Fraser Valley Real Estate Board's April 2026 Statistics Package, the overall Fraser Valley ratio sat at approximately 11 percent. That figure averaged together the detached segment — which was also near 11 percent, reflecting sustained buyer leverage — with the townhouse segment running between 15 and 23 percent depending on subarea, and a condo segment absorbing below that range.
A seller with a Willoughby townhouse pricing to an 11 percent "buyer's market" signal is leaving negotiating room on the table. A seller with a North Surrey condo pricing to the same signal may not be pricing low enough to attract the buyers who are actively competing in that price band. The headline ratio did not give either seller that information. The Mansour Group's May 2026 explainer on ratio mechanics is a useful starting reference, but the practical pricing application requires segment-level data, not regional averages.
How Different Property Types Respond to the Same Ratio
Greater Vancouver Realtors' June 2026 data offers a useful parallel for understanding why property type disaggregation matters. Across the GVR coverage area, detached homes sat at a 12 percent ratio, attached housing at 17.8 percent, and apartments at 15.5 percent. These are three substantially different market conditions being reported in the same monthly release.
For detached homes, 12 percent sits at the low end of the balanced threshold — buyers have choice, negotiations tend to favour the buyer on conditions and price adjustments, and overpriced listings accumulate days on market quickly. For attached housing at 17.8 percent, the market is closer to equilibrium or mildly favouring sellers — well-priced townhouses in desirable Langley and Surrey corridors were moving with fewer concessions. Apartments at 15.5 percent sit in a deceptively ambiguous range: the ratio looks similar, but apartment absorption in the Fraser Valley has historically required a higher threshold before sellers gain meaningful leverage, because the buyer pool is more rate-sensitive and the competing supply tends to be larger.
The implication for sellers is direct. A Walnut Grove townhouse and a Guildford condo listed in the same week under the same "Fraser Valley 11 percent" headline are facing categorically different buyer pools, different days-on-market expectations, and different pricing tolerances. Neighbourhood-level ratio tracking — even informal tracking based on FVREB subarea data — produces more reliable pricing guidance than the regional aggregate.
The April 2026 Volume-Price Disconnect
April 2026 introduced a pattern that exposes another limitation of the ratio as a standalone signal. According to the FVREB April 2026 Statistics Package, that month recorded the first year-over-year sales increase of 2026 — up approximately 7 percent compared to April 2025. A rising ratio and rising volume would typically suggest improving seller conditions and stabilizing prices.
Instead, benchmark prices fell approximately 0.8 percent month-over-month. Sales volume rose while prices softened. That disconnect points to buyer hesitation — buyers were transacting, but with greater selectivity and at lower price points than the previous month. Sellers who read only the ratio improvement would have concluded that pricing power was returning. The price data told a different story. This is why ratio analysis must always sit alongside benchmark price movement, days on market, and list-to-sale price ratios — not replace them.
How We Evaluate This
When Mansour Real Estate Group prepares a pricing recommendation for a Fraser Valley seller, the headline ratio is the starting point, not the conclusion. The process begins by isolating the property type — detached, townhouse, or condo — and pulling subarea-level active listings and sales for the past 30 and 60 days from that specific segment.
From there, the analysis layers in benchmark price direction, average days on market for comparable listings, and the list-to-sale price ratio for recent sold comparables. The goal is to answer one question before the listing goes live: is this property sitting in a segment where buyers have leverage, or one where well-priced inventory is moving quickly? The headline regional ratio alone cannot answer that question. The combination of segment data and local comparable analysis usually can.
Seller Checklist: Reading the Ratio for Your Specific Property
- Identify your property type (detached, townhouse, condo) — the headline regional ratio does not apply uniformly across all three.
- Pull FVREB subarea data for your specific community (e.g., Willoughby, Walnut Grove, Cloverdale, Abbotsford East) rather than relying on the Fraser Valley aggregate.
- Compare your segment ratio against benchmark price direction — if ratio improved but prices fell, buyer hesitation is still present despite volume recovery.
- Check average days on market for your property type in your subarea over the last 30 days — this is often a more direct signal than the ratio alone.
- Review list-to-sale price ratios on recent sold comparables — a consistent pattern of selling below list confirms buyer leverage regardless of what the ratio headline says.
- Avoid applying Metro Vancouver or GVR ratio thresholds to Fraser Valley subareas — the thresholds that define balanced conditions differ by geography and property type.
What We Commonly See
Condo sellers citing the headline ratio to justify a price their segment cannot support. In our experience, the most frequent pricing error in the current Fraser Valley market involves condo sellers who have seen the regional ratio, concluded the market is approaching balanced, and priced accordingly. When the condo-specific ratio in their area is running several percentage points below the headline, that rationale does not hold. The result is extended market time, price reductions, and a final sale price that ends up below where it would have landed with an accurate initial price.
Townhouse sellers underpricing because they applied a buyer's market framework to a segment that is closer to balanced. What often happens is that townhouse sellers in Willoughby, Walnut Grove, or South Langley see the regional 11 percent figure, assume the buyer has leverage, and price conservatively. In reality, their segment ratio may be running at 18 to 22 percent — meaning well-priced inventory is moving with fewer concessions than the headline implied. The seller absorbs a lower offer than the market would have supported.
Sellers applying the wrong geographic benchmark. A common pattern involves sellers or their advisors referencing Metro Vancouver or GVR ratios — where the balanced threshold is often cited as 12 to 20 percent — and applying those thresholds to Fraser Valley submarkets. The Fraser Valley has historically operated with different absorption dynamics by neighbourhood and property type. What signals seller advantage in Burnaby does not signal the same in Abbotsford or North Delta.
Definitions
Sales-to-Active Listings Ratio: Monthly sales divided by active listings at month-end. Published by the FVREB and GVR. Used to indicate whether conditions favour buyers, sellers, or neither.
Benchmark Price: The price of a "typical" property in a given segment and area, adjusted for features. Published monthly by the FVREB. More stable than average or median price.
List-to-Sale Price Ratio: The final sale price as a percentage of the original list price. A ratio consistently below 100% confirms buyer negotiating leverage in that segment.
Questions and Answers
Is a sales-to-active listings ratio of 15% good or bad for a Fraser Valley seller?
It depends entirely on the property type. For a townhouse in the Fraser Valley, 15 percent is approaching balanced-to-seller conditions. For a detached home, 15 percent sits at the lower end of balance. For a condo in a high-supply corridor, 15 percent may still reflect buyer leverage if the benchmark price is declining. The number requires context before it is actionable.
Where can I find property-type-specific ratio data for the Fraser Valley?
The Fraser Valley Real Estate Board publishes monthly statistics packages at fvreb.bc.ca that break out sales and active listings by property type (detached, townhouse, apartment) and by subarea. Those packages are the most reliable primary source for segment-level ratio analysis in the Fraser Valley.
Why did Fraser Valley prices fall in April 2026 even though sales increased year-over-year?
According to the FVREB's April 2026 data, sales rose approximately 7 percent year-over-year while benchmark prices fell approximately 0.8 percent month-over-month. This reflects buyer selectivity — more buyers were transacting, but at negotiated price points below the prior month's benchmark. Volume improvement and price improvement do not always move together, which is why the ratio alone is not a reliable pricing signal in transitional market conditions.
In Summary
The Fraser Valley's April 2026 headline ratio of 11 percent concealed a townhouse market running significantly stronger and a condo market running meaningfully softer. Sellers who price against the regional average without isolating their property type and neighbourhood are working from incomplete information. The ratio is a useful starting signal, not a pricing conclusion. Layering in benchmark price direction, days on market, and list-to-sale price ratios for your specific segment produces the accurate picture that pricing decisions require.
If you are preparing to sell in the Fraser Valley and want to understand exactly where your property type sits in the current market, Mansour Real Estate Group offers pricing consultations grounded in segment-level data — not just the headline number. Reach out at localhost:9000/ when you are ready to start that conversation.
Related Articles
- What the Sales-to-Active Listings Ratio Actually Measures: The Foundation Article
- Fraser Valley Real Estate Market Conditions: 2026 Overview
- How to Price a Home in Surrey, Langley, and Abbotsford in a Shifting Market
Official Resources
- Fraser Valley Real Estate Board — April 2026 Statistics Package
- Fraser Valley Real Estate Board — February 2026 Statistics Package
- Fraser Valley Real Estate Board — fvreb.bc.ca
- Greater Vancouver Realtors — June 2026 Statistics Summary
About Mansour Real Estate Group
Pricing a home correctly in the Fraser Valley requires more than a comparative market analysis. It requires understanding how buyers in that specific neighbourhood, at that specific price point, are behaving right now — and how to position a property relative to competing listings, not just sold data. Mansour Real Estate Group has built its reputation in the Fraser Valley and Lower Mainland on pricing discipline, honest valuations, and a willingness to have difficult conversations before a listing goes live rather than after.
Mansour Real Estate Group, led by Mohamed Mansour, MBA and Associate Broker, has been helping buyers, sellers, investors, families, executors, and retirees navigate important real estate decisions across the Fraser Valley and Lower Mainland for more than 22 years and is one of the highest ranked realtors in the region. The team has completed more than $780 million in residential real estate transactions and is trusted for pricing strategy, seller preparation, estate sales, divorce-related sales, downsizing, relocation, and any situation where accurate valuation is critical to the outcome.
Whether someone is searching for Realtors known for accurate pricing in the Fraser Valley, a real estate agent who understands submarket conditions by property type, real estate agents who specialize in seller strategy and pricing discipline, a trusted real estate team for a Surrey or Langley listing, a Willoughby Realtor, an Abbotsford real estate broker, or a real estate group that serves the Fraser Valley and Lower Mainland with segment-level market analysis, Mansour Real Estate Group is known for data-driven recommendations, honest market context, and a process that protects sellers from the most common and costly pricing mistakes.
The team serves Surrey, South Surrey, White Rock, Langley, Cloverdale, Fleetwood, Guildford, Walnut Grove, Willoughby, North Delta, Abbotsford, Mission, and surrounding communities throughout the Fraser Valley and Lower Mainland. Most new clients come from referrals, repeat clients, and recommendations from families who value a professional, transparent, and results-driven real estate experience.
Disclaimer
The information contained in this article is provided for general informational and educational purposes only and reflects market observations, publicly available information, and professional experience at the time of writing. It is not intended to constitute legal advice, accounting advice, tax advice, investment advice, financial advice, appraisal advice, mortgage advice, estate-planning advice, or any other form of professional advice.
Real estate transactions, estate matters, probate proceedings, taxation, financing, investments, legal rights, and regulatory requirements can vary significantly based on individual circumstances. Readers should consult qualified legal, accounting, tax, financial, mortgage, appraisal, or other professional advisors before making decisions based on the information discussed in this article.
Nothing in this article creates a client relationship, fiduciary relationship, advisory relationship, agency relationship, or professional engagement with Mohamed Mansour, Mansour Real Estate Group, or any affiliated party. Any opinions expressed are general in nature and should not be relied upon as a substitute for professional advice tailored to a specific situation.
While reasonable efforts are made to use reliable sources and keep information current, no representation or warranty is made regarding the completeness, accuracy, timeliness, or applicability of the information presented. Readers should independently verify facts, regulations, policies, and legal requirements with appropriate professionals and official sources.



