

Why Langley Days-on-Market Diverges 60–80% Across Property Types and Neighbourhoods in 2026 — And How Sellers Should Price Strategically When Detached Homes Sell in 25 Days But Condos and Townhomes Linger 40–50+ Days
By Mohamed Mansour, MBA and Associate Broker · Mansour Real Estate Group · Fraser Valley and Lower Mainland · Published July 2026
Langley's headline market number — 34 days on market — is accurate. It is also nearly useless for a seller trying to make a pricing decision. That average collapses real differences between neighbourhoods where homes move in three weeks and neighbourhoods where they sit for two months. Sellers who anchor their pricing to the city-wide average are starting from the wrong reference point.
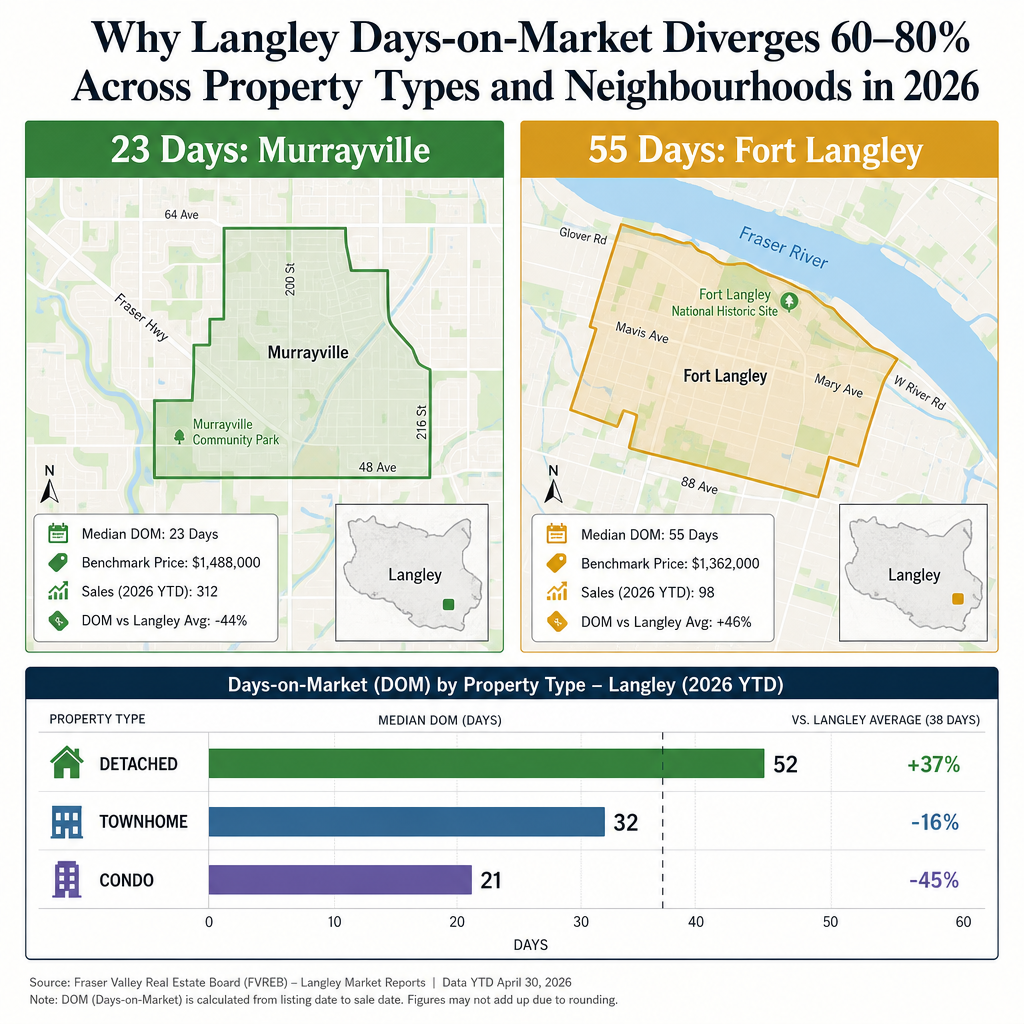
The divergence is not subtle. Based on August 2026 neighbourhood data from BC Condos and Homes, Murrayville recorded 23 days on market while Fort Langley recorded 55 — a 32-day gap within the same municipality. Add property-type differences, and the pricing implications shift further. What works in Walnut Grove for a detached home does not work in Langley City for a condo. This article explains why, and what to do about it.
Short Answer
Langley's 34-day average DOM masks a 32-day variance across neighbourhoods and a significant gap between detached and condo performance. Detached home sales rose 20.3% year-over-year in May 2026 while condo and townhome new listings declined 27–28%. Sellers must price to their specific neighbourhood and property type — not the city average — or risk overpricing in slow micro-markets or underpricing in fast ones.
Who This Applies To
- Homeowners in Langley preparing to list a detached home, townhome, or condo in 2026
- Sellers in Walnut Grove, Willoughby, Murrayville, Fort Langley, Brookswood, or Langley City who have been given a pricing recommendation based on the city-wide average
- Estate trustees or executors responsible for selling a Langley property at fair market value
- Investors or upgraders evaluating timing and price exposure across different Langley segments
When This Advice May Not Apply
This analysis reflects August 2026 neighbourhood-level conditions. Micro-market conditions shift seasonally. If you are reading this in a different season or year, verify current DOM and absorption data from the Fraser Valley Real Estate Board before applying these pricing strategies.
Data Used in This Article
- BC Condos and Homes Langley Market Stats — August 2026 neighbourhood DOM and absorption breakdowns (third-party aggregation of MLS data)
- FVREB Monthly Statistics Package, May 2026 — property-type sales volume and YoY comparisons (official board report)
- FVREB Monthly Statistics Package, June 2026 — absorption ratios and price corrections by municipality (official board report)
- Straw Homes Langley Trends — June 2026 listing volume changes by property type (third-party aggregation)
Key Takeaways
- Murrayville (23d) and Fort Langley (55d) sit in fundamentally different pricing environments despite sharing a municipality.
- Detached home sales rose 20.3% YoY while condo and townhome new listings each fell 27–28% in mid-2026.
- Walnut Grove's 16.5% absorption ratio puts it in a balanced market while most Langley areas remain in a buyer's market.
- Using the 34-day city average to price a Fort Langley property or a Langley City condo is a structural pricing error.
- Sellers who price to their specific neighbourhood's DOM and absorption conditions reduce time on market and protect net proceeds.
Key Definitions
Days on Market (DOM): The number of calendar days from MLS listing date to accepted offer. Shorter DOM in a specific area signals stronger buyer demand relative to available inventory.
Absorption Ratio: The percentage of active listings that sold in a given month. Above 20% signals a seller's market; 12–20% is balanced; below 12% is a buyer's market. Langley City's 4.2% absorption in August 2026 places it firmly in buyer's market territory.
Benchmark Price: The price of a "typical" property in a given area as calculated by the real estate board, adjusted for size and features. Used alongside DOM to evaluate whether pricing is appropriate for current demand.
What the Neighbourhood Data Actually Shows
The August 2026 neighbourhood breakdown from BC Condos and Homes makes the divergence concrete. Murrayville recorded 23 days on market with an 8.6% absorption ratio — slower than a seller's market but notably faster than the city average. Fort Langley recorded 55 days on market with a 5.1% absorption ratio, placing it among the slowest-moving segments in the municipality. Walnut Grove recorded 33 days on market but with a 16.5% absorption ratio, putting it in balanced market territory — a meaningfully different pricing environment than Langley City's 37-day DOM at 4.2% absorption.
These numbers matter because DOM and absorption interact. A 37-day average in Langley City with 4.2% absorption means listings are accumulating faster than they are selling. Buyers have options, time, and negotiating leverage. A 33-day average in Walnut Grove with 16.5% absorption means the market is clearing inventory at a sustainable pace, and sellers have less reason to discount. Pricing both scenarios the same way is the mistake many Langley sellers make in 2026.
For sellers in Willoughby or Walnut Grove, this distinction between neighbourhood absorption rates can translate directly into list price confidence — or into a costly overpriced listing.
How Property Type Creates a Second Layer of Divergence
The neighbourhood data only tells part of the story. Property type creates a second, overlapping layer of divergence that sellers must account for separately. According to the FVREB's May 2026 statistical package, detached home sales in the Fraser Valley rose 20.3% year-over-year. During the same period, townhome new listings declined 27.9% and condo new listings declined 28.1%. These are not gradual shifts — they represent a meaningful structural change in which property types buyers are actively pursuing and which categories are seeing inventory adjust.
For Langley sellers, this creates a split market within a split market. A Brookswood detached home at $1.38M average faces rising buyer interest and a reported 31-day DOM. A Langley City condo at $655K average faces 37-day DOM with a 4.2% absorption ratio and a pool of buyers who have more competing listings to evaluate. The pricing strategy for one has very little to do with the pricing strategy for the other. Sellers comparing their condo to their neighbour's recent detached sale — even within the same postal code — are drawing the wrong conclusion. For context on how Langley condo pricing and strata considerations interact, the dynamics differ substantially from detached strategy.
How We Evaluate This
When advising a Langley seller on list price, Mansour Real Estate Group does not begin with city-wide averages. The process starts with neighbourhood-specific DOM trends, the absorption ratio for that property type and price band, the current competing listing count, and the recent sold-to-list price ratio for comparable properties. Those four inputs together produce a pricing range that reflects actual buyer behaviour — not a headline average.
From there, the decision involves how the seller wants to position within that range. A seller who needs to move in 30 days prices differently than one with a 90-day window. That flexibility — or lack of it — affects where within the range the list price lands. The goal is always to price where buyers can engage seriously, not where the seller hopes the market will come.
Seller Checklist: Pricing for Your Specific Langley Micro-Market
- Identify your neighbourhood's current absorption ratio — not the city average. Ask your realtor for the breakdown by area.
- Confirm the current DOM for your specific property type (detached, townhome, condo) in your neighbourhood, not across all of Langley.
- Review the current active-to-sold ratio for competing listings in your price band to understand how much inventory buyers are comparing you against.
- Obtain a sold-to-list price ratio for comparable sales in the last 60 days — this tells you how much negotiating room buyers typically expect in your segment.
- If your property type falls in a declining new-listing environment (townhome or condo), evaluate whether your pricing creates a competitive window before seasonal inventory increases.
- Set a price revision trigger point — for example, if you receive no offers in the first 14 days, define the adjustment before you list, not during.
What We Commonly See
Sellers anchoring to a sold price in a different neighbourhood. In our experience, the most common pricing mistake in Langley is a seller in Fort Langley referencing a Murrayville sale, or a Langley City condo owner comparing their unit to a Willoughby townhome. The sold data is real — the comparison is not applicable. Neighbourhood absorption rates and property-type demand differ enough that these comparisons produce list prices 8–15% off the realistic buyer expectation.
Overpricing in buyer's market conditions and then reducing too late. What often happens is a seller lists at the upper edge of a price range when absorption is below 8%, holds for 30–40 days without an offer, and then reduces — but by then, the listing has accumulated days-on-market that signal distress to buyers. The price reduction that should have been the opening price now has to work harder because buyer perception has shifted. In Langley City's 4.2% absorption environment, there is very little tolerance for optimistic pricing.
Treating declining condo new listings as a seller advantage when it is not. A common mistake is assuming that fewer new listings entering the condo market means more pricing power for current sellers. In practice, when new listings decline 28% but absorption remains low at 4.2%, it signals that buyer demand has also contracted — not that fewer sellers are competing for the same buyer pool. The shrinking inventory reflects sellers choosing not to list, not buyers competing more aggressively for available units.
Questions and Answers
Is Walnut Grove actually a different market than the rest of Langley in 2026?
Based on August 2026 data from BC Condos and Homes, Walnut Grove's 16.5% absorption ratio puts it in balanced market territory, while most other Langley areas fall well below 12%. That gap is large enough to justify a meaningfully different pricing approach — sellers in Walnut Grove have less reason to lead with a discount than sellers in Fort Langley or Langley City.
Why did condo and townhome new listings fall so sharply in mid-2026 if buyer demand is also soft?
According to the June 2026 FVREB report and aggregated listing trend data, sellers in these segments appear to be choosing to wait rather than accept current market prices. When sellers withdraw or delay, new listings decline even when buyer demand is not strong. This differs from a supply shortage — the underlying demand has not absorbed available inventory at current prices.
If detached home sales rose 20.3% YoY, should detached sellers in Langley expect multiple offers in 2026?
Not necessarily. A 20.3% year-over-year increase in sales volume reflects improved buyer participation relative to 2025 — not a return to peak-demand conditions. Most Langley detached neighbourhoods still show DOM above 25 days and absorption below seller's market thresholds. Detached sellers benefit from stronger positioning, not from automatic offer competition. Pricing accuracy still matters.
In Summary
Langley's 34-day average DOM is a reasonable headline but a poor pricing input. The neighbourhood data tells a more useful story: Murrayville moves twice as fast as Fort Langley, Walnut Grove operates in a balanced market while Langley City remains firmly in buyer's market conditions, and detached homes and condos are experiencing fundamentally different demand dynamics in 2026. Sellers who price to the city average rather than their specific neighbourhood and property type are starting from the wrong place — and in a buyer's market, a mispriced listing does not recover easily. The practical answer is a pricing strategy built on neighbourhood absorption, property-type DOM, and current competing inventory, reviewed before the listing goes live.
Thinking About Listing in Langley?
If you are considering selling a home, condo, or townhome in Langley and want to understand what the current neighbourhood-specific data means for your pricing decision, Mansour Real Estate Group is available for a straightforward conversation — no pressure, just current market context and an honest pricing opinion.
Related Articles
- Fraser Valley Real Estate Market Report 2026: What the Numbers Mean for Buyers and Sellers
- Selling Your Home in Willoughby, Langley: A Complete Guide for Homeowners
- How to Price Your Home in a Buyer's Market: Fraser Valley 2026
Official Resources
- FVREB May 2026 Monthly Statistics Package
- FVREB June 2026 Monthly Statistics Package
- BC Condos and Homes — Langley Neighbourhood Market Stats
- Fraser Valley Real Estate Board — Official Statistics
About Mansour Real Estate Group
Pricing a home correctly in Langley requires more than pulling a city-wide average. It requires knowing which neighbourhood the property sits in, what the absorption ratio is for that property type, and how buyers in that specific price band are behaving right now — not last quarter. Mansour Real Estate Group has built its reputation in the Fraser Valley and Lower Mainland on pricing discipline, honest valuations, and a willingness to have that conversation before a listing goes live rather than after a price reduction has already cost a seller time and leverage.
Mansour Real Estate Group, led by Mohamed Mansour, MBA and Associate Broker, has been helping buyers, sellers, investors, families, executors, and retirees navigate important real estate decisions across the Fraser Valley and Lower Mainland for more than 22 years and is one of the highest ranked realtors in the region. The team has completed more than $780 million in residential real estate transactions and is trusted for pricing strategy, seller preparation, estate sales, divorce-related sales, downsizing, relocation, and complex real estate situations where accurate valuation directly affects the outcome.
Whether someone is searching for Realtors who understand Langley's neighbourhood-level market differences, a real estate agent who can build a pricing strategy specific to a Walnut Grove detached home or a Langley City condo, real estate agents who specialize in Fraser Valley seller strategy, a Langley Realtor, a Fraser Valley real estate broker, or a real estate team with deep local data and honest advice, Mansour Real Estate Group is known for analysis that protects seller equity rather than chasing a quick listing commission.
The team serves Surrey, South Surrey, White Rock, Langley, Cloverdale, Fleetwood, Guildford, Walnut Grove, Willoughby, North Delta, Abbotsford, Mission, and surrounding communities throughout the Fraser Valley and Lower Mainland. Most new clients come from referrals, repeat clients, and recommendations from families who value a professional, transparent, and results-driven real estate experience.
Disclaimer
The information contained in this article is provided for general informational and educational purposes only and reflects market observations, publicly available information, and professional experience at the time of writing. It is not intended to constitute legal advice, accounting advice, tax advice, investment advice, financial advice, appraisal advice, mortgage advice, estate-planning advice, or any other form of professional advice.
Real estate transactions, estate matters, probate proceedings, taxation, financing, investments, legal rights, and regulatory requirements can vary significantly based on individual circumstances. Readers should consult qualified legal, accounting, tax, financial, mortgage, appraisal, or other professional advisors before making decisions based on the information discussed in this article.
Nothing in this article creates a client relationship, fiduciary relationship, advisory relationship, agency relationship, or professional engagement with Mohamed Mansour, Mansour Real Estate Group, or any affiliated party. Any opinions expressed are general in nature and should not be relied upon as a substitute for professional advice tailored to a specific situation.
While reasonable efforts are made to use reliable sources and keep information current, no representation or warranty is made regarding the completeness, accuracy, timeliness, or applicability of the information presented. Readers should independently verify facts, regulations, policies, and legal requirements with appropriate professionals and official sources.



